
In Advanced Placement (AP) Statistics, hypothesis testing and statistical inference represent the capstone of quantitative reasoning, accounting for 30% to 40% of the AP Exam and serving as the primary bridge between raw empirical data and defensible scientific conclusions. Under the College Board’s rigorous 4-Step Inference Model (State, Plan, Do, Conclude), high school students are required to master highly structured, standardized sentence formulas to define population parameters, verify three mandatory mathematical conditions (Randomness, 10% Independence n ≤ 0.10N, and Large Counts/Normality), execute precise test statistics and degrees of freedom calculations, and state non-deterministic conclusions in context.
However, high school statistics educators face a profound pedagogical dilemma in the age of generative artificial intelligence: generic, black-box AI text detectors trigger rampant false-positive alarms on honest student work because authentic AP conclusion templates are inherently formulaic, high-frequency, and low-perplexity. Simultaneously, these same commercial detectors completely fail to catch the catastrophic conceptual hallucinations that generative Large Language Models (LLMs) produce—including deterministic phrasing (“we accept the null hypothesis”, “this proves the alternative hypothesis is 100% true”), confabulated degrees of freedom formulas, and disconnected condition checks that copy prompt text without verifying empirical counts.
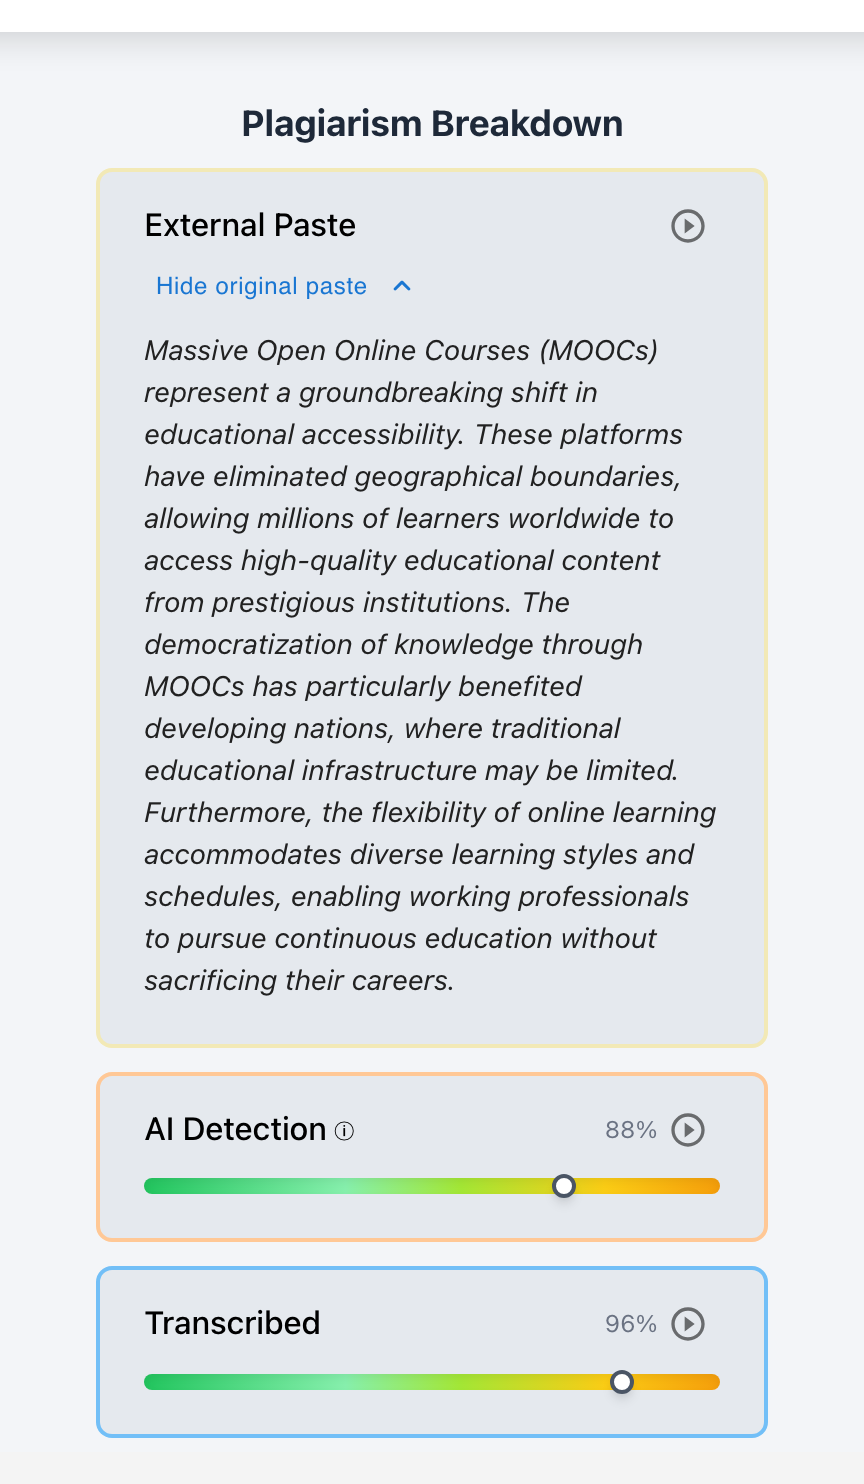
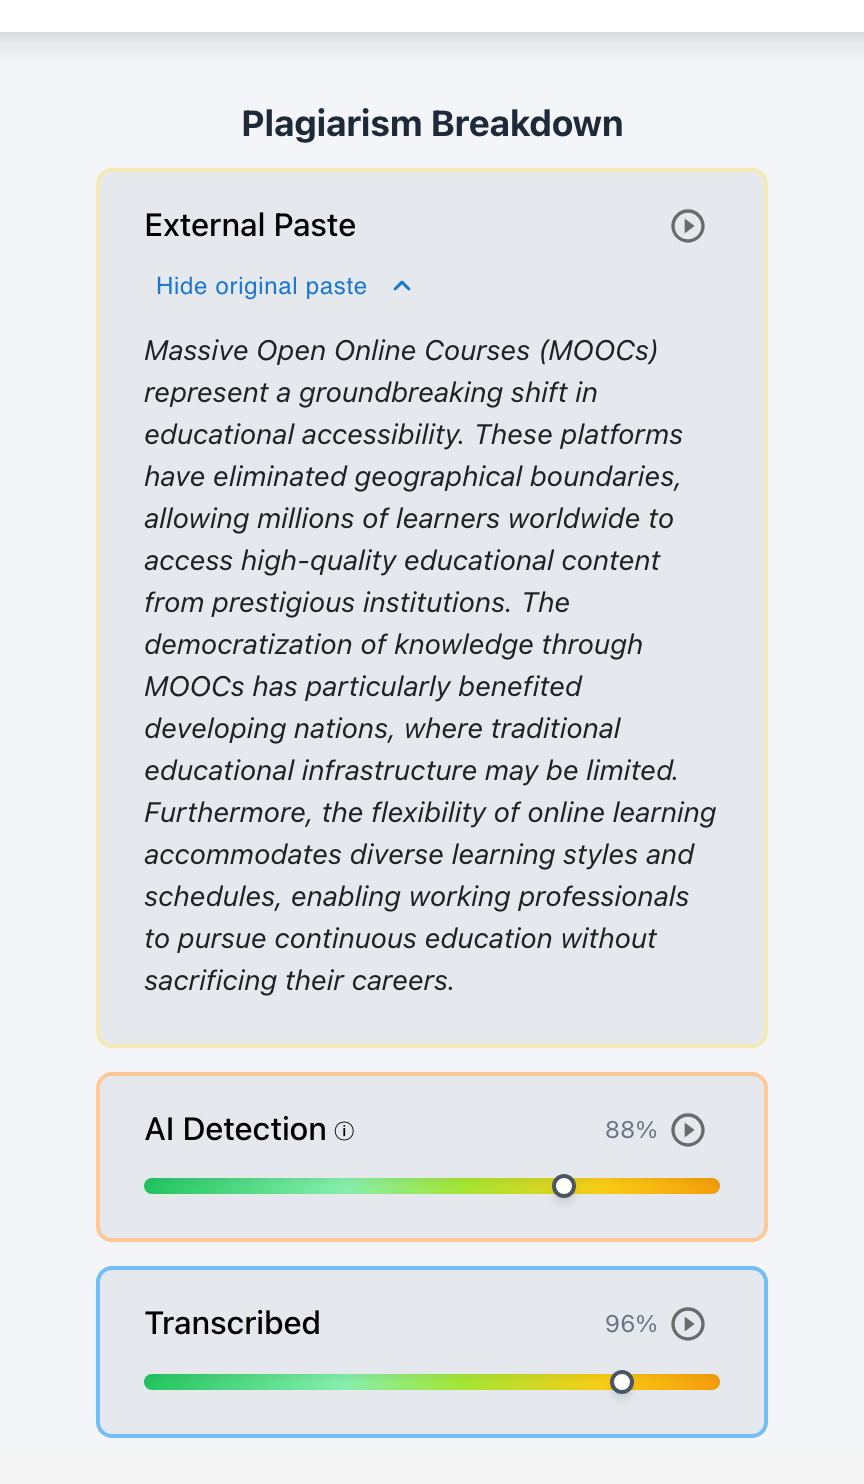
Checkmark Plagiarism resolves this crisis by shifting the paradigm from opaque whole-document text classification to transparent, multidimensional writing telemetry. Through patent-pending Essay Playback™ (1x–8x keystroke replay), passage-level calibrated confidence sliders, external paste buffer preservation, and quote-anchored AP rubric autograding, educators can verify authentic cognitive workflows—such as natural 2-to-5-minute pauses for TI-84/Desmos calculations, condition checking iterations, and self-corrected contextual parameters—while catching unauthorized synthetic generation with unassailable objective proof.
Checkmark Plagiarism provides the pedagogical and technical foundation for process-based academic integrity by combining patent-pending Essay Playback™ with passage-level calibrated AI detection, defensible side-by-side plagiarism checking, quote-anchored AP rubric autograding, and direct LMS integrations for Canvas LMS, Google Classroom, and Buzz LMS.
1. The Anatomy of AP Statistics 4-Step Inference (State, Plan, Do, Conclude)
In high school AP Statistics (and introductory dual-enrollment college statistics), hypothesis testing is not merely a mechanical arithmetic computation. It is a formal, four-phase evidentiary argument designed to quantify sample variability against a theoretical null model.
The College Board’s AP Statistics Course and Exam Description (CED) mandates a rigid structural protocol for all Free-Response Questions (FRQs) involving significance tests and confidence intervals. Every authentic student submission must execute all four steps with absolute contextual precision.
- Define Parameters in Context: Specify true population parameter with units (e.g., μ = true mean reaction time in seconds; p = true proportion).
- State Null Hypothesis (H0): Model of no effect or no difference (e.g., H0: μ1 − μ2 = 0 or H0: p = p0).
- State Alternative Hypothesis (Ha): Directional or non-directional claim (<, >, or ≠).
- State Significance Level (α): Explicitly specify alpha threshold (α = 0.05 or α = 0.01).
- Identify Procedure: Name specific test (e.g., Two-Sample t-Test for μ1 − μ2; 1-Proportion z-Test).
- Condition 1 (Randomness): Verify random sampling or randomized comparative experimental allocation stated in prompt.
- Condition 2 (10% Independence): Verify n ≤ 0.10N when sampling without replacement.
- Condition 3 (Large Counts / Normality): Show explicit arithmetic (np0 ≥ 10, n(1 − p0) ≥ 10; or CLT n ≥ 30; or plot check).
- General Formula: Test Statistic = (Statistic − Parameter) / (Standard Error of Statistic).
- Calculations & Substitutions: Substitute sample statistics into formula to calculate z, t, or χ2.
- Degrees of Freedom (df): Report Welch-Satterthwaite approximation (e.g. df = 95.34) or conservative df.
- Exact P-Value: Calculate and report P-value matching alternative hypothesis direction (e.g., P(t < −4.08) ≈ 0.00005).
- Mathematical Inequality: Explicitly compare P-value to significance level (P-value ≤ α vs. P > α).
- Formal Null Decision: State “Reject H0” or “Fail to reject H0” (NEVER “Accept H0”).
- Contextual Evidence Statement: State “There is [or is not] convincing statistical evidence that...” accompanied by full parameter restatement in context.
- Non-Deterministic Tone: Avoid claims of absolute proof or certainty.
Deep Dive: Step 1 — STATE (Parameters, Hypotheses, and Alpha)
Authentic student writing in the State phase requires strict separation between population parameters (Greek letters μ, p) and sample statistics (x̄, p̂).
- Parameter Definition: The student must state: “Let μ1 represent the true mean reaction time (in seconds) for high school seniors after consuming 100mg of caffeine, and let μ2 represent the true mean reaction time for high school seniors consuming a placebo.”
- The Hypotheses:
H0: μ1 − μ2 = 0 (or μ1 = μ2)
Ha: μ1 − μ2 < 0 (or μ1 < μ2) - Significance Level: The student must explicitly state: “We will test at the α = 0.05 significance level.”
On the AP Statistics exam, writing sample statistics in the hypotheses (e.g., H0: x̄1 = x̄2) results in an automatic rubric deduction from Essentially Correct (E) to Partially Correct (P) or Incorrect (I). Students must define parameters as true population characteristics, not observed sample values.
Deep Dive: Step 2 — PLAN (Procedure Identification and the 3 Mandatory Conditions)
The Plan phase separates rote calculation from true statistical reasoning. Students cannot simply state “Conditions are met.” They must explicitly name the test and show the exact arithmetic and contextual rationale for all three conditions:
Observational Studies: Data must come from a well-designed Simple Random Sample (SRS).
Comparative Experiments: Subjects must be randomly assigned to treatment groups.
Authentic Student Prose: “Random: The problem states that 50 students were randomly assigned to the caffeinated group and 50 students were randomly assigned to the placebo group.”
Formula: n ≤ 0.10N when sampling without replacement from a finite population.
Critical Nuance: When an experiment utilizes randomized allocation, the 10% condition is NOT checked because subjects are not sampled from a finite population without replacement.
Authentic Student Prose: “10% Condition: It is reasonable to assume that 50 students is less than 10% of all high school seniors in the district (50 ≤ 0.10(5,000)).”
Proportions (z-tests): Requires np0 ≥ 10 and n(1 − p0) ≥ 10. Must show explicit multiplication: (120)(0.45) = 54 ≥ 10 and (120)(0.55) = 66 ≥ 10.
Means (t-tests): Stated normal population; OR Central Limit Theorem sample size n ≥ 30; OR boxplot/dotplot inspection showing no strong skewness or outliers.
Deep Dive: Step 3 — DO (Formulas, Test Statistics, Degrees of Freedom, and P-Values)
In the Do phase, high school students must show the algebraic structure of the test statistic, substitute sample values, state degrees of freedom, and report the calculated P-value.
For a Two-Sample t-Test for the difference between two means (μ1 − μ2):
- Degrees of Freedom (df):
- Option A (TI-84 / Calculator Welch-Satterthwaite approximation): df = 95.34
- Option B (Conservative Formula): df = min(n1 − 1, n2 − 1) = min(49, 49) = 49
- P-Value Calculation: P-value = P(t < −4.077 with df = 95.34) ≈ 0.000049 (< 0.0001)
Deep Dive: Step 4 — CONCLUDE (The 3-Part Non-Deterministic Interpretation)
The final step—Conclude—is where student understanding is most sharply tested and where AI tools most frequently commit catastrophic errors. An essentially correct AP Statistics conclusion requires three interconnected elements:
- Explicit Inequality Linking P-Value to α: “Because our P-value (0.00005) is less than our significance level (α = 0.05)...”
- Formal Null Decision: “...we reject the null hypothesis H0.”
- Contextualized Interpretation of Alternative Hypothesis: “...There is convincing statistical evidence that the true mean reaction time for high school seniors consuming 100mg of caffeine is significantly faster (lower) than for high school seniors consuming a placebo.”
| AP Scoring Rating | Student Submission Phrasing | AP CED Rationale |
|---|---|---|
|
Essentially Correct (E) Full Credit |
“Since P-value = 0.00005 < α = 0.05, we reject H0. There is convincing statistical evidence that the true mean reaction time for caffeinated seniors is lower than for placebo seniors.” |
• Explicit inequality comparison • Correct null rejection • Non-deterministic language • Full contextual parameter & units |
|
Partially Correct (P) Partial Credit |
“Since P is small, we reject H0. The caffeine improves reaction time.” |
• Missing explicit α comparison • Vague contextual statement • Lacks parameter & population clarity |
|
Incorrect (I) Fatal AI Error |
“Because P < 0.05, we accept the alternative hypothesis. This proves that caffeine makes every student faster and proves H0 is 100% false.” | • FATAL AI ERROR: Commercial LLMs routinely state “accept Ha” and claim absolute mathematical proof. |
2. The LLM Hallucination Trap: Why Generative AI Fails AP Statistics Inference
Generative Large Language Models (such as GPT-4o, Claude 3.5 Sonnet, and Gemini Pro) are trained on vast corpora of internet text. However, LLMs are probabilistic language engines, not statistical calculation engines. When high school students prompt an LLM to complete an AP Statistics hypothesis test, the AI frequently produces text that sounds mathematically sophisticated but contains fatal conceptual and procedural errors that violate AP grading rubrics.
LLMs frequently state “we accept H0” or “Ha is proven true beyond a shadow of doubt.” In frequentist statistics, failing to reject H0 is not proof of the null. Stating “accept H0” is an automatic rubric downgrade on the AP exam.
LLMs default to pooled equal variance formulas (sp2) unapproved in the AP CED, fabricating non-standard integer degrees of freedom (e.g., df = 98) instead of unpooled Welch-Satterthwaite calculator values (df = 95.34).
LLMs output generic sentences: “Normality is met because data is assumed normal under the CLT.” They routinely fail to calculate prompt-specific arithmetic (such as np0 ≥ 10 and n(1 − p0) ≥ 10) or confuse proportion conditions with mean conditions.
LLMs confuse sample statistics with population parameters (defining μ as “the sample mean”) and make unwarranted causal claims on observational studies without random assignment (claiming correlation “proves cause”).
3. The Pedagogical Dilemma: Standardized AP Templates vs Generic AI Detectors
High school statistics teachers and secondary mathematics department chairs find themselves in a severe instructional bind when using commercial, generic AI detection tools (such as Turnitin AI writing indicator, GPTZero, or CopyLeaks) on AP Statistics assignments.
- Mandates standardized, predictable sentence frames (“Because the P-value of [X] is less than alpha of [Y]...”)
- Heavy structural repetition across nationwide cohorts
- High predictability and strict non-deterministic phraseology
- Penalizes creative, informal, or unpredictable writing
- Flags low-perplexity, formulaic text as “90%–100% AI Generated”
- Triggers massive false-positive alarms on honest students who followed instructions
- Blind to mathematical correctness and calculator degrees of freedom
- Easily fooled by ChatGPT paraphrasers that add conversational fluff
Because thousands of students across the nation write these exact AP conclusion formulas, a generic AI detector assigns them an extremely low perplexity score and near-zero burstiness—instantly flagging an honest high school junior’s authentic work as “85%–100% AI Generated.”
Simultaneously, a generic AI detector does not know mathematics. It cannot recognize that saying “we accept the null hypothesis” is an epistemological disaster, nor can it identify that df = 95.34 came from a TI-84 calculator while df = 49 came from a conservative approximation.
4. What Authentic Student Statistical Drafting Actually Looks Like (Writing Telemetry & Cognitive Pauses)
To establish true academic integrity in AP Statistics, educators must look beyond static surface text and examine the chronological writing process telemetry.
When a high school student solves an AP Statistics Free-Response inference question on a Chromebook in Google Docs, Canvas, or Buzz LMS, their cognitive workflow follows a distinct, multi-phase rhythm characterized by calculation pauses, formula lookups, and revision iterations.
Duration: 2.5 min
Student reads problem prompt, distinguishes population parameters from sample statistics, types out parameter definitions, and self-corrects to add units (“reaction time in seconds”). Types null and alternative hypotheses; explicitly defines α = 0.05.
Duration: 3.75 min
Student identifies test procedure (Two-Sample t-Test). Verifies Randomness condition by quoting prompt sentence regarding randomized allocation. Types out sample sizes n1 = 50, n2 = 50 and notes CLT applies (n ≥ 30). Features natural 30–45 second pauses to consult AP formula sheet.
Key Signal
CRITICAL WRITING TELEMETRY SIGNAL: 3.5 to 4.5 minutes of complete keyboard inactivity. During this window, the student enters lists (L1, L2) or summary statistics into their handheld TI-84 Plus CE (STAT → TESTS → 4: 2-SampTTest, Pooled: No). The calculator computes t = −4.077, p = 0.000049, df = 95.34.
Duration: 3.75 min
Student returns to keyboard; types formula with values plugged in. Types test statistic t = −4.08, df = 95.34, P-value = 0.00005. Drafts 3-part conclusion template; rereads prompt to ensure parameter is stated in full context without deterministic claims.
Telemetry Comparison: Authentic Drafting vs. Instant AI Paste vs. Mechanical Transcribing
By analyzing writing telemetry signals—including character entry velocity, backspace/deletion frequency, typing pauses, and paste buffer events—educators can immediately distinguish authentic statistical problem-solving from unauthorized AI usage.
| Writing Telemetry Signal | Authentic Drafting | Instant AI Paste | Mechanical Transcribe |
|---|---|---|---|
| Total Session Duration | 12–20 minutes per FRQ | < 45 seconds total | 4–7 minutes total |
| Keyboard Inactivity (Calculator Breaks) | Distinct 2–5 min pauses for TI-84 data entry & computation | Zero calculation pauses; instantaneous full paste | Continuous steady typing without calculation pauses |
| Keystroke Velocity | Variable: 35–65 WPM with bursts & contemplation | N/A (single paste event) | Uniform: 70–95 WPM without rhythm variation |
| Deletion / Edits Ratio | 12%–22% of total keystrokes (refining parameter text) | 0% in-app edits | < 3% edits (minor typo corrections only) |
| Paste Buffer Content | Small raw numbers or variable names only | Massive single block of formatted text & math | Zero paste events; text typed from secondary phone screen |
| Math Typography | Standard keyboard dashes, slashes (/), or LaTeX | Clean Unicode math symbols (μ, α, ≠, ≤, √) | Clean Unicode math symbols copied from phone screen |
5. The AP Statistics Evidentiary Matrix
When auditing an AP Statistics hypothesis test, investigative task, or multi-day take-home lab, how do different integrity methods compare?
| Evaluation Criterion | Paper In-Class Writing | Generic AI Detector | Google Docs History | Checkmark Telemetry |
|---|---|---|---|---|
| Evaluates Mathematical Inference Validity | High (Teacher sees manual work) | None (Black-box linguistic score) | None (Tracks raw character diffs) | High (Flags AP rubric steps) |
| Captures Calculator Crunching Pauses | Visible on scratch paper | None (Not supported) | None (Collapses 10-min snapshots) | Exact pause duration log |
| Detects AI Text Copy-Pasting | High (In-person proctoring) | Low (High false positives) | Moderate (Shows large chunks) | Exact paste buffer audit |
| Catches Retyping from Second Screen / Phone | High (Live proctor supervision) | None (Blind to typing mechanics) | Low (Looks like fast typing) | High (Flags uniform cadence) |
| Distinguishes Standard CED Template Phrasing | Low (Teacher reads manually) | Fail (Flags templates as AI) | None (Not supported) | High (Exempt calibrated sliders) |
| Preserves Overwritten Paste Buffer History | None | None | Low (Replaced on subsequent edits) | 100% Buffer Preserved |
6. Step-by-Step High School Statistics Teacher Audit Protocol
When evaluating an AP Statistics hypothesis testing assignment, investigative task, or multi-day take-home lab, educators should utilize a four-phase forensic audit protocol.
Verify whether the student calculated actual sample values (np0, n(1 − p0), n1 ≥ 30) or simply pasted generic boilerplate (“Normality is assumed”). Check whether the student correctly distinguished randomized experimental assignment from random sampling.
Grab a TI-84 Plus CE or open Desmos. Re-run 2-SampTTest or 1-PropZTest with the prompt data. Compare the test statistic (t), degrees of freedom (df), and P-value. If the student reports pooled degrees of freedom (df = 98 instead of 95.34) or shows an invented z-score with no matching calculator syntax, flag for review.
Scrub through the writing session at 2x–4x speed using Essay Playback™. Confirm a natural 2-to-5-minute keyboard pause between Plan and Do for calculator crunching. Check the external paste inspector: was the conclusion pasted as a single block from an external AI window, or composed keystroke-by-keystroke?
Sit down with the student and review the objective Essay Playback™ timeline together. Ask a diagnostic concept question: “Explain why we rejected H0 here, and why we didn’t say we accept H0.” Differentiate between unauthorized AI generation and genuine math struggle, providing a restorative opportunity to re-test using authentic in-class calculations.
7. Real High School Classroom Case Scenarios
Case Scenario 1: 12th Grade AP Stats — The Two-Sample t-Test for Reaction Times
ExoneratedThe Assignment: A timed take-home Chromebook assignment in Canvas LMS analyzing an experimental dataset: Caffeine vs. Placebo Reaction Times in Seconds (n1 = 50, n2 = 50).
- The Incident: Turnitin flagged the student’s submission as 94% AI Generated. The teacher noticed that the student’s Step 4 conclusion contained classic, perfect College Board phrasing: “Because the P-value of 0.00005 is less than alpha = 0.05, we reject the null hypothesis...”
- The Telemetry Audit: The teacher opened Checkmark Essay Playback™: total drafting time was 16 minutes, 42 seconds. Between minute 05:20 and 09:45 (a 4-minute, 25-second interval), the keyboard was completely idle while the student entered the 100 data points into their physical TI-84 Plus CE calculator. At minute 09:46, the student returned to type t = −4.077, df = 95.34, and P = 0.000049, followed by character-by-character typing of the conclusion.
- The Outcome: The teacher completely exonerated the student. The high AI score on the generic detector was caused entirely by the formulaic nature of AP conclusion templates. Checkmark’s writing telemetry provided unassailable proof of authentic student drafting.
Case Scenario 2: 11th Grade AP Stats — The Two-Proportion z-Test on Sleep Deprivation
Misconduct ConfirmedThe Assignment: A weekend research writeup investigating whether the proportion of high school student-athletes sleeping under 6 hours per night differs from non-athletes (n1 = 120, n2 = 140).
- The Incident: A student submitted an impeccably formatted Google Doc with flawless LaTeX mathematical equations and a conclusion reading: “Because P = 0.0031 < 0.05, we accept the alternative hypothesis, proving that athletic participation definitively causes sleep deprivation.”
- The Telemetry Audit: Checkmark revealed total active document time was 1 minute, 14 seconds. The paste inspector flagged a single paste event of 412 words at timestamp 00:32 originating from an external browser clipboard. The condition checks omitted mandatory large counts multiplication, and the conclusion committed the fatal LLM error of stating “we accept the alternative hypothesis” with unjustified causal claims.
- The Outcome: In a restorative conference, the teacher presented the paste timestamp and conceptual errors. The student admitted to prompting ChatGPT-4o and completed an in-person remediation test on inference conditions and non-deterministic conclusions.
Case Scenario 3: AP Capstone / AP Stats Interdisciplinary Research Project
Targeted RemediationThe Assignment: A multi-week Capstone Seminar and AP Statistics combined research paper analyzing local municipal traffic flow and air quality metrics across four intersections.
- The Incident: The student submitted a 12-page research paper with a matched-pairs t-test. The draft contained complex statistical discourse interspersed with verbatim paragraphs from online environmental engineering reports.
- The Telemetry Audit: Checkmark’s side-by-side plagiarism source quotes identified uncited patchwriting from a 2023 Department of Transportation study. However, Essay Playback™ revealed that the statistical data analysis section (Do and Conclude steps) was authored natively over six separate 45-minute working sessions with authentic calculator breaks.
- The Outcome: Rather than issuing a blanket plagiarism suspension, the teachers held a targeted citation workshop. The student was guided on proper APA attribution for secondary literature while receiving full credit for their independently executed statistical calculations.
8. How Checkmark Plagiarism Empowers High School AP Statistics Educators
Evaluates specific paragraphs independently rather than assigning a toxic whole-paper score. Calibrated to recognize standardized AP Statistics formulaic templates (e.g., CED conclusion stems) and prevent false-positive alarms on honest student work.
Reconstructs the entire writing session keystroke by keystroke. Allows teachers to scrub through drafting timelines to visually verify calculator breaks, formula entry, condition checking iterations, and organic text revisions.
Captures and preserves 100% of clipboard text pasted into documents from external windows. Preserves original pasted text even if the student subsequently edits, rewords, or reformats every individual sentence.
Autogrades 4-step inference writeups against custom AP rubrics (Essentially Correct, Partially Correct, Incorrect). Generates quote-anchored written justifications tied directly to student prose, saving teachers dozens of grading hours across heavy 150-student class rosters.
Student mathematical calculations, telemetry, and personal data are NEVER used to train commercial AI models. Enterprise-grade cloud security with complete data privacy for K-12 school districts.
9. Frequently Asked Questions (FAQs for AP Statistics Teachers & STEM Leaders)
Why do AP Statistics conclusion templates consistently score high on generic AI detectors?
Generic AI text detectors evaluate perplexity (word predictability) and burstiness (sentence rhythm variation). The College Board’s AP Statistics curriculum mandates strict, standardized sentence frames for hypothesis test conclusions (e.g., “Because the P-value of [X] is less than alpha of [Y], we reject H0. There is convincing statistical evidence that...”). Because these sentences are highly predictable and structurally uniform across thousands of student essays, generic detectors erroneously classify them as machine-generated text. Checkmark uses passage-level calibrated analysis and keystroke writing telemetry to prevent these false-positive flags.
What is the single biggest statistical error AI tools make in AP inference conclusions?
The most frequent and severe error made by generative AI models is using deterministic language—specifically writing “we accept the null hypothesis” or “this proves the alternative hypothesis is true.” In frequentist statistics, we never accept H0; we only fail to reject it. Furthermore, statistical tests provide empirical evidence, not absolute mathematical proof. Writing “accept H0” results in an immediate deduction on the AP Exam rubric.
How does Essay Playback capture calculator breaks when students work on physical TI-84s or Chromebook Desmos tabs?
When a high school student inputs data lists into a physical handheld calculator (TI-84 Plus CE, TI-Nspire CX II, Casio fx-9750GIII) or switches to a Desmos graphing calculator tab, keyboard input temporarily ceases. In Checkmark’s Essay Playback™, this appears as a natural 2-to-5-minute cognitive calculation pause between the Plan phase (condition checks) and the Do phase (test statistic output). When the student finishes running the calculator procedure, typing resumes as they record t, df, and the P-value. A total absence of calculation pauses followed by an instantaneous dump of complex numbers is a primary indicator of unauthorized external AI generation.
What should an AP Stats teacher do when a student submits the Welch-Satterthwaite decimal degrees of freedom vs conservative integer df?
Both degrees of freedom methods are accepted under the College Board AP Statistics CED:
1. Welch-Satterthwaite Approximation: Produces non-integer degrees of freedom (e.g., df = 95.34), which is the standard automatic output of TI-84/TI-Nspire calculators (2-SampTTest).
2. Conservative Formula: Uses df = min(n1 − 1, n2 − 1) (e.g., df = 49).
If a student reports an unpooled test with df = 95.34, it confirms they used a physical graphing calculator. If a student reports a pooled df = n1 + n2 − 2 = 98 without stating equal variances were assumed, it frequently indicates an LLM output that defaulted to pooled variance formulas.
How does Checkmark distinguish between student typing from memory vs mechanical transcription from a phone?
Authentic student typing from memory exhibits natural burstiness: rapid typing of familiar phrases followed by 3-to-10-second pauses to check numbers, self-correct parameter wording, and fix typos (typically resulting in a 12%–22% backspace/edit ratio). In contrast, mechanical transcription (where a student reads an AI-generated answer off a smartphone or secondary screen and retypes it into their Chromebook) exhibits an unnaturally steady, continuous keystroke cadence (70–95 WPM) with near-zero conceptual pauses and an edit ratio under 3%.
How can department chairs support AP Stats teachers dealing with parent disputes over AI flags?
When a parent challenges an academic integrity flag on a statistics assignment, relying on a generic “85% AI” score from a black-box detector creates an adversarial, unprovable confrontation. Department chairs should use Checkmark’s Essay Playback™ to walk parents through the objective timeline: showing the complete absence of calculation pauses, the exact timestamp of external paste events, and the conceptual errors (such as “accepting the null”) that directly match synthetic LLM outputs. This shifts the conference from an emotional dispute into an objective, evidence-based academic review.
How does Checkmark integrate with Google Classroom, Canvas LMS, and Buzz LMS for AP Statistics assignments?
Checkmark seamlessly integrates with major K-12 learning management systems via LTI 1.3 and Chrome extensions. When teachers create an AP Statistics assignment in Canvas LMS, Google Classroom, or Buzz LMS, Checkmark runs automatically in the background of the student’s editing environment (Google Docs or LMS native editor). Teachers can review writing telemetry, inspect paste buffers, and sync quote-anchored rubric feedback directly into their LMS gradebook with a single click.
10. Conclusion: Stop Guessing, Start Trusting in High School STEM Writing
Statistical reasoning is one of the most vital critical-thinking skills taught in modern secondary education. In an era where generative AI can produce superficially convincing text in seconds, maintaining academic integrity in AP Statistics is essential to ensuring that students develop genuine quantitative literacy, empirical skepticism, and scientific communication skills.
By replacing opaque, black-box AI percentage scores with transparent writing telemetry, patent-pending Essay Playback™, and passage-level evidence cards, Checkmark Plagiarism empowers high school math educators to protect honest students, catch genuine academic misconduct with objective proof, and foster a culture of transparent, restorative learning.
Empower Your STEM & AP Statistics Faculty
Equip your mathematics department with process-based writing telemetry, TI-84 calculation pause tracking, and quote-anchored AP rubric autograding.