
Executive Summary
Advanced Placement Environmental Science (APES) requires high school students to leave the climate-controlled classroom and step into the messy, non-linear realities of natural ecosystems—deploying quadrat frames across campus lawns, conducting Winkler dissolved oxygen titrations along local creeks, sorting benthic macroinvertebrates in stream riffles, and calculating Simpson’s Diversity Index (D). However, when high schoolers encounter rain-soaked paper field sheets, unexpected zero-counts, broken digital probes, or the pressure of 45-minute lab blocks, they increasingly turn to generative Large Language Models (LLMs) to fabricate “idealized” synthetic datasets and generate generic Claim-Evidence-Reasoning (CER) reports unmoored from their physical fieldwork.
Generic whole-document AI percentage detectors fail science educators by triggering chronic false positives on structured CER sentence starters and mandatory ecological vocabulary (eutrophication, benthic macroinvertebrates, trophic level, limiting nutrient) while remaining completely blind to copy-pasted synthetic data tables. This comprehensive guide provides APES instructors, secondary science department chairs, and STEM curriculum directors with an actionable, five-step evidentiary audit protocol. By combining raw physical-to-digital concordance checks, regional biome sanity audits, clipboard payload inspection, and Checkmark’s patent-pending Essay Playback™ writing telemetry, educators can definitively verify authentic empirical inquiry, protect honest student researchers from false accusations, and transform anomalous data into profound pedagogical opportunities.
The AP Environmental Science Fieldwork Mandate & Quantitative Sampling
The College Board’s AP Environmental Science Course and Exam Description (CED) mandates that a minimum of 25% of instructional time be dedicated to hands-on, inquiry-based laboratory and field investigations, with many exemplary programs committing 35% to 40%. Unlike introductory chemistry or physics labs conducted in controlled environments with pre-measured reagents, APES fieldwork thrusts 15-to-18-year-old students into open, dynamic natural systems.
In secondary school settings—where high school science teachers routinely manage 130 to 160 students distributed across five or six class periods on 1:1 Chromebooks—field inquiries take place in campus woodlots, drainage retention ponds, athletic field borders, urban park creeks, and agricultural plots. Students navigate mud, wind, and equipment limitations while gathering raw empirical data to master two fundamental College Board proficiencies:
- AP Science Practice 5 (Data Analysis): Performing quantitative calculations, computing ecological diversity indices, plotting regression lines, identifying statistical trends, and conducting rigorous error analyses.
- AP Science Practice 6 (Scientific Argumentation): Developing formal scientific explanations using the Claim-Evidence-Reasoning (CER) framework—proposing a defensible ecological claim, supporting it with specific empirical data collected in the field, and articulating mechanistic ecological reasoning grounded in biogeochemical principles.
PVC quadrat floral sampling, stream kick-net macro sorting, Winkler DO titrations, optical probes, soil core augers.
Simpson’s Index (D), Shannon-Wiener (H’), DO saturation %, EPT index, USDA soil texture triangle ratios.
Defensible Claim (C), Empirical Evidence citations (E), Mechanistic Ecological Reasoning (R), Error Analysis.
Core APES Field Sampling Protocols & Mathematical Artifacts
To audit student lab submissions effectively, educators must understand the exact empirical protocols students execute and the specific mathematical artifacts generated during genuine fieldwork:
Table 1.0: Core APES Sampling Protocols, Methodologies & Mathematical Outputs
| Investigation Domain | Fieldwork & Sampling Protocol | Key Quantitative Metrics & Artifacts |
|---|---|---|
| Terrestrial Floral Biodiversity | 1m × 1m PVC quadrat frames along 50m transects; species abundance tally (n) of groundcover. | Species Richness (S), Simpson’s Index D, Shannon-Wiener H’. |
| Aquatic Physical & Chemical Health | Surface grab samples; Winkler chemical titrations vs optical DO probes; Secchi disk depth; N/P colorimetry. | DO (mg/L), % saturation, Water Temp (°C), pH, Turbidity (NTU), Nitrates/Phosphates (ppm). |
| Stream Macroinvertebrate Bioassay | D-frame kick net sampling across 3 riffle zones; sorting into sensitivity tiers (EPT vs tolerant). | EPT Taxa Richness, Total Taxa Richness, Family Biotic Index (FBI). |
| Soil Horizon Pedology & Infiltration | Auger core extraction; 48-hr soil settling jar hydrometer test; percolation tube timing. | % Sand / % Silt / % Clay, USDA Texture Triangle class, Infiltration rate (mL/min). |
| Microclimate & Forest Canopy | Spherical crown densiometer; Lux/PAR meter; sling psychrometer; soil vs ambient thermometers. | % Canopy closure, Solar Lux / PAR, Relative humidity (%), Δ-T (Soil vs Air °C). |
Simpson’s Index of Diversity (D)
Where n = number of individuals of a particular species, and N = total number of individuals of all species. Value ranges strictly from 0 (monoculture) to 1.0 (infinite diversity).
Theoretical DO Maximum (1 atm)
At 20°C at sea level, DO saturation limit is ≈ 9.1 mg/L. Reports claiming 16.5 mg/L at 26°C violate gas solubility laws and indicate AI hallucination.
The Claim-Evidence-Reasoning (CER) Structure in APES
High school science educators teach students to articulate scientific conclusions using the three-part CER structure:
A direct, defensible ecological proposition.
Directly addresses the environmental question without personal pronouns or speculative language.
Empirical quantitative field measurements.
Cites specific measured metrics (DO drops, turbidity spikes, Simpson’s D values, EPT taxa counts).
Biogeochemical & ecological mechanism.
Explains why the empirical data occurred based on established scientific principles and limiting factors.
The “Synthetic Fieldwork” Crisis in High School Science Labs
Every high school science educator recognizes the chaotic reality of outdoor sampling days. Unlike laboratory simulations where conditions are sterile and constant, outdoor fieldwork introduces unavoidable physical friction:
- Sudden 42°F drizzle soaked pencil sheets; mud-smeared clipboard margins.
- Replicate kick-net trials yield 4 organisms, then 19, then 0 due to gravel shift.
- Zero stoneflies found in suburban detention pond; 14 midge larvae collected.
- Vernier optical DO probe battery died midway through Transect 2.
- Soil settling jar water remains cloudy after 48 hours; clay height hard to read.
- Bell rings before Trial 3 finishes; students leave with missing data cells.
- Immaculate 72°F sunny weather reported on a 40°F rainy Tuesday.
- Artificial zero-variance data tables; standard deviations exactly equal across sites.
- Pristine mountain stoneflies and brook trout hallucinated in a Georgia ditch.
- Perfect linear regression curve (R2 = 0.9998) for DO vs. temperature.
- Soil texture percentages sum to impossible 114% (sand 50%, silt 40%, clay 24%).
- 850 words of flawless, generic college-level CER prose pasted in 2 seconds.
Why High School Students Fabricate Field Data with AI
When high schoolers encounter messy field realities, four distinct psychological and academic pressures drive them to generative AI:
- The “Clean Data” Fallacy: Conditioned by years of introductory cookbook science labs where every experiment had a predetermined “right answer,” high school students panic when their empirical data appears chaotic, non-linear, or zero-heavy. They mistakenly assume that finding zero macroinvertebrates or getting a murky titration endpoint will result in an automatic point deduction.
- Time Scarcity and Absenteeism: In a high school schedule with sports practices, AP exams, club meetings, and part-time jobs, students who miss the single outdoor field day due to illness find it impossible to “make up” an outdoor creek sampling session individually. Rather than asking the teacher for raw group data, they prompt an LLM to invent an entire field dataset.
- The Siren Song of the Text-to-Table Prompt: A student types: “Give me a realistic APES data table for a stream lab with good water quality and 3 kick-net trials, plus a Simpson’s index calculation and a 500-word CER discussion.” In under four seconds, the LLM produces a comprehensive, beautifully formatted table that looks authoritative and polished.
- Fear of AP Science Practice 6 (CER) Writing: High school students frequently struggle to bridge the conceptual gap between raw numbers and ecological mechanisms. Generating a CER paragraph through AI bypasses the rigorous cognitive labor of articulating why high biochemical oxygen demand (BOD) from agricultural runoff depresses dissolved oxygen levels.
The Hallmarks of AI-Synthesized Field Reports
Biome & Habitat Hallucinations
LLMs pull from textbook examples of pristine Pacific Northwest or Appalachian mountain streams. An APES class sampling a warm, low-gradient coastal plain ditch in Georgia receives reports citing cold-water Plecoptera (Stonefly) nymphs, or Phoenix students submitting forest floor Mayapples (Podophyllum peltatum) in the Sonoran desert.
Synthetic Zero-Variance Tables
Authentic outdoor data has stochastic noise. AI-generated tables display artificial smoothness, uniform standard deviations across all quadrats, and correlation coefficients (R2 > 0.99) that never occur in wild, unmanipulated natural systems.
Mathematical Impossibilities
Soil texture fractions (sand + silt + clay) that sum to 108% or 89% rather than 100%. Simpson’s Index calculations where D > 1.0 or where the typed math steps do not equal the final reported index number. Dissolved oxygen values violating Henry’s Law gas solubility.
The “Unmoored CER” Disconnect
The student’s document contains a real class data table, but the accompanying CER argument cites numbers that appear nowhere in their own table, or discusses insect families that were never collected by any group in the school’s class sections.
Why Generic Whole-Document AI Detectors Fail in AP Science
Many high school science departments attempt to police AI usage using standard whole-document AI detection tools embedded in legacy LMS platforms. In the context of AP Environmental Science and secondary STEM education, these generic tools are fundamentally broken.
- 1. Formulaic CER Stems Trigger False Alarms: When a student writes, “The data collected along the 50-meter riparian transect supports the claim that anthropogenic runoff significantly decreases benthic macroinvertebrate biodiversity...”, generic detectors flag the paragraph as high AI probability because the syntax is predictable and academic. The student is penalized for following the College Board scoring guide.
- 2. Mandatory Domain Nomenclature: AP Environmental Science requires precise, standardized vocabulary. Terms like photosynthetic active radiation, biochemical oxygen demand, oligotrophic, cation exchange capacity, and allochthonous organic matter have low token perplexity in LLM training sets, triggering false flags on honest student papers.
- 3. Total Blindness to Numerical Data Tables: Generic AI scanners evaluate natural language sentences. They do not parse numerical calculations, balance chemical equations, or audit biological datasets. A student who pastes a completely fabricated 5-column, 10-row synthetic macroinvertebrate data table from ChatGPT receives a “0% AI Flag” on the table itself.
- 4. Opaque Black-Box Scores Cannot Stand in Parent Conferences: A single percentage number (e.g., “78% AI”) provides zero evidentiary proof (“receipts”). This causes severe friction with parents, guidance counselors, and school administration when an integrity violation is contested.
The High School Environmental Science Evidentiary Matrix
To establish a defensible, pedagogical audit system, high school science educators must compare the capabilities and limitations of available evidentiary tools:
Table 2.0: Environmental Science Lab Integrity Evidentiary Matrix
| Evaluation Dimension | Muddy Paper Field Sheets | Generic AI Detectors | Google Docs Revision History | Checkmark Scientific Telemetry & Playback™ |
|---|---|---|---|---|
| Captures Raw Physical Sampling | High (Original ink, mud, initials) | None (Blind to physical context) | None (Only tracks digital text entry) | High (Timestamped photo audit in Appendix) |
| Identifies Biome Hallucinations | Moderate (Manual teacher check) | None (Cannot check biological plausibility) | None (Cannot verify biological facts) | High (Passage cards highlight unmoored claims) |
| Differentiates CER Stems from AI | N/A (Paper only) | Fails (Chronic false positives on CER) | Poor (Shows typed text without confidence) | High (Calibrated sliders filter human syntax) |
| External Clipboard Injections (LLMs) | None | Fails (Evaluates static text only) | Partial (Shows text chunk; no prompt payload) | Definitive (Preserves exact raw clipboard payload) |
| Calculation & Math Telemetry | High (Scratched pencil math on margin) | None (Ignores math workflows) | Poor (Only shows final pasted number) | Definitive (Replays calculation pauses at 1x–8x) |
| Defensibility in Parent Conferences | Moderate (Good for raw data) | Unusable (Opaque black-box disputes) | Weak (Clunky snapshots lack context) | Complete (Video-like replay provides receipts) |
| Teacher Grading Load (140+ Reports) | Unmanageable (Flipping 140 paper logs: 15+ hrs) | Misleading (Manual review of false flags) | Exhausting (Clicking 140 doc revision logs) | Streamlined (Rubric Autograder saves 8+ hrs/wk) |
Step-by-Step APES Teacher Audit Protocol for Local Ecosystem Studies
This five-step workflow enables high school APES teachers and science departments to audit local ecosystem lab reports efficiently across large student loads:
Assign 4 student lab roles (*Lead Sampler*, *Equipment Specialist*, *Data Recorder*, *Safety Officer*). Mandate raw pencil field sheets with role initials. Before leaving the field site, require a timestamped smartphone photo of the sheet embedded as Appendix A in the final report. Spot-check digital tables against Appendix A.
Cross-reference species lists against state DNR or local riverkeeper biodiversity indices. Verify abiotic parameters against physical limits (DO saturation curves vs. temperature). Validate soil texture ratios (Sand % + Silt % + Clay % = 100%).
Scrub the writing session at 1x–8x speed in Checkmark Essay Playback™. Observe natural cognitive pauses during Simpson’s Index math. Flag instantaneous chunk injections where 600 words of CER appear in 2 seconds.
Open Checkmark Paste Inspector to review raw injected clipboard text. Differentiate legitimate sensor CSV exports (Vernier/Pasco) from LLM conversational text. Inspect original prompt strings even if the student spent 20 minutes paraphrasing the pasted content.
Shift the conversation from punitive cheating allegations to genuine scientific inquiry. Reframe messy or zero-heavy data as valuable experimental error. Direct the student to earn full credit via a rigorous “Error Analysis & Limitations” revision.
- [00:00] Sets up headings & table format
- [08:12] Manually types raw data values from clipboard photo
- [14:30] PAUSE (4.5 min): Calculates Simpson’s Index on scrap paper
- [19:00] Types formula: D = 1 - (sum n(n-1) / N(N-1)); makes 3 typo fixes
- [27:45] Drafts Claim sentence; pauses; deletes second half; rewires syntax
- [35:10] Writes Evidence paragraph citing specific data points from Table 1
- [42:30] Writes Reasoning; backspaces to adjust terms (“eutrophic” to “hypoxic”)
- [00:00] Opens blank document
- [01:15] EXTERNAL PASTE: 850 words (Data Table + Complete CER)
- [02:00] Changes font size; deletes “Certainly! Here is your lab report:”
- [02:45] Submits assignment to LMS
Checkmark’s Purpose-Built Tooling for High School Science Departments
Checkmark Plagiarism delivers an integrated, high-school-tailored integrity ecosystem designed to eliminate guesswork and support science teachers grading stacks of 140+ lab reports every weekend:
Passage-Level AI Confidence Sliders
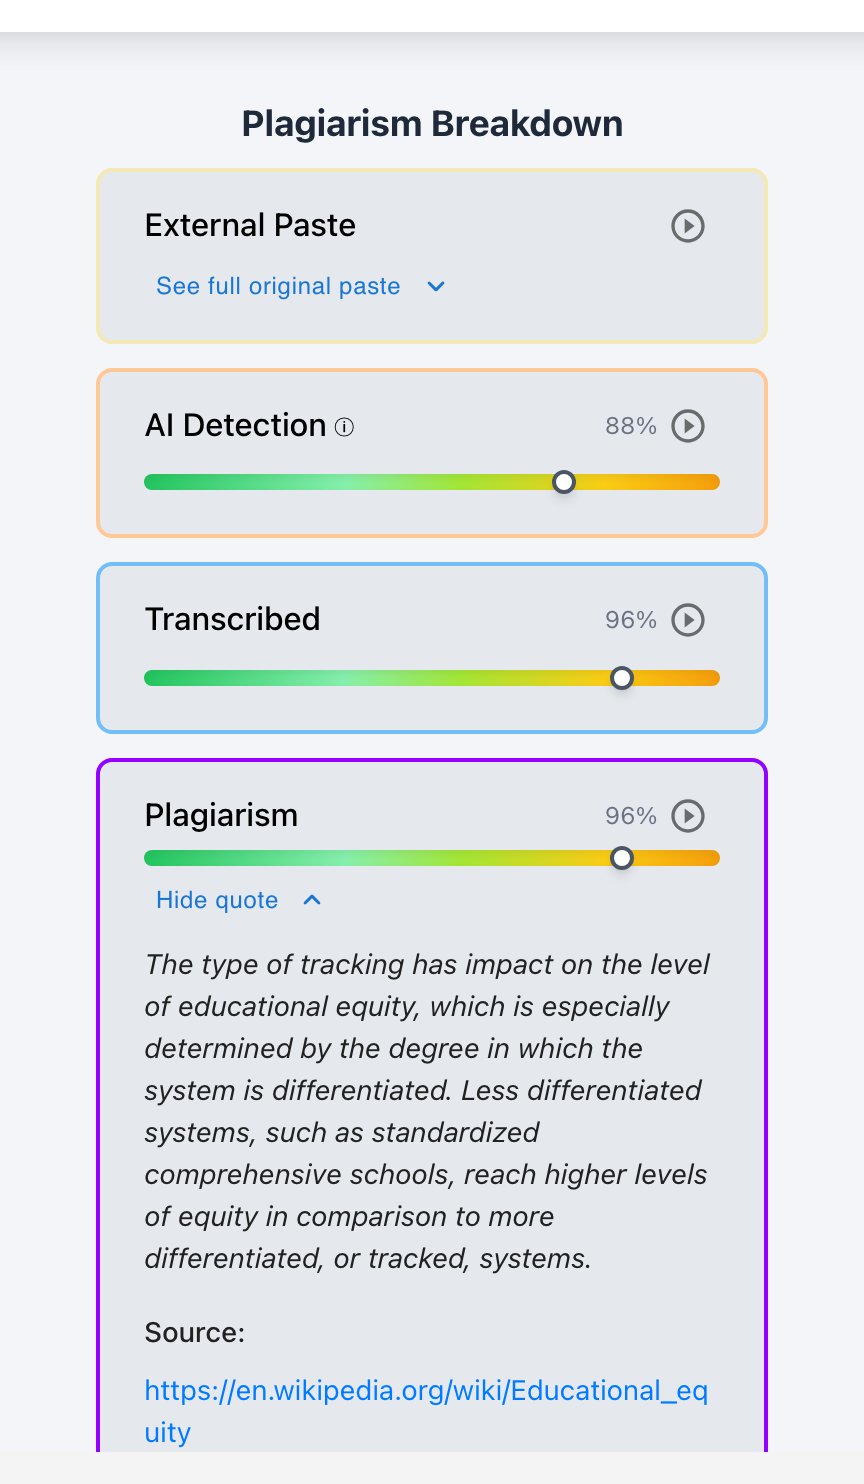
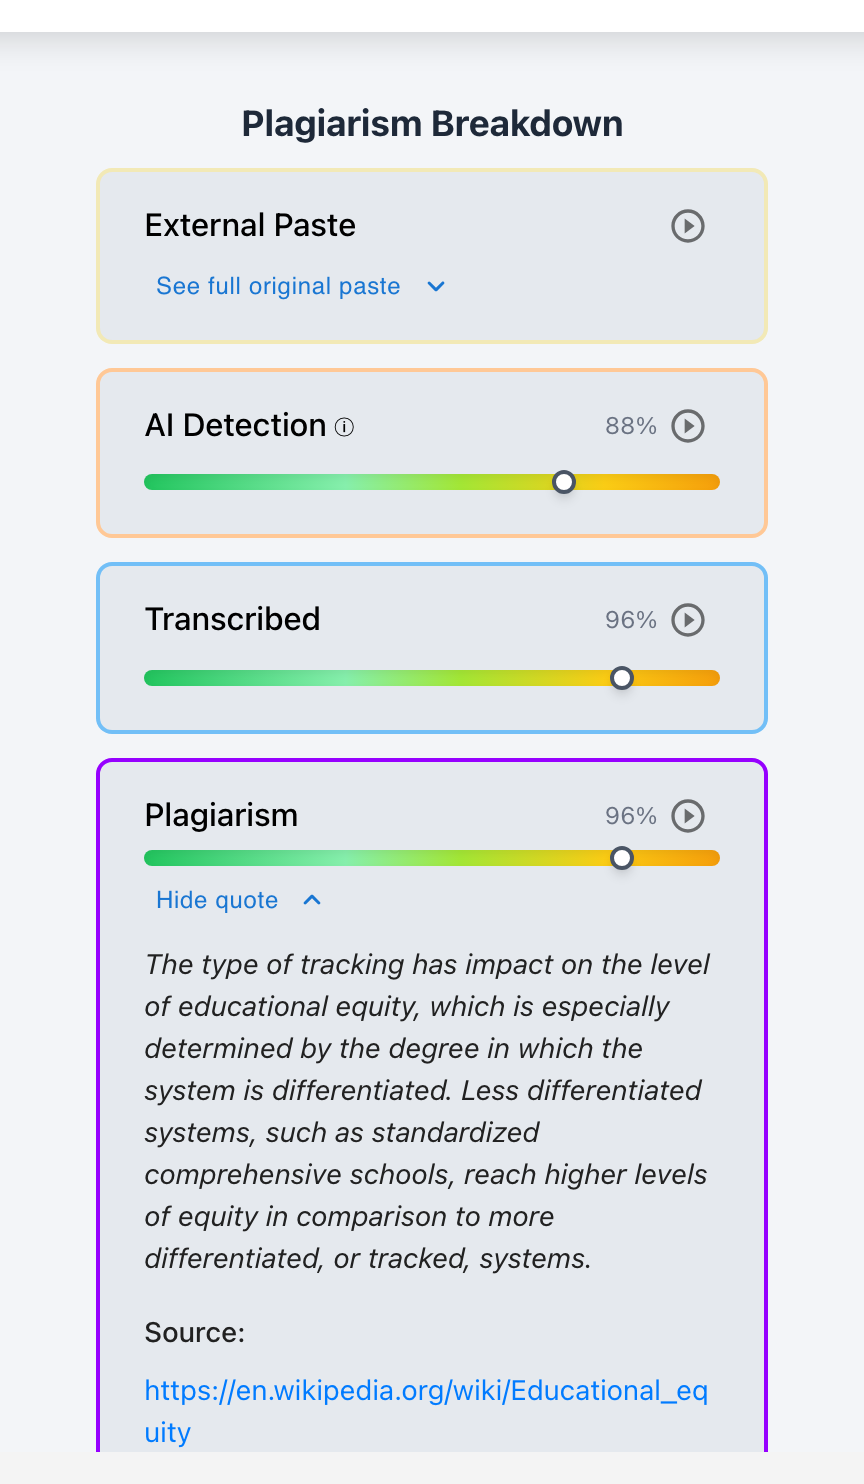
Analyzes text sentence by sentence. Accurately ignores standard CER starters while highlighting synthetic prose, backed by strict <150-word short-text guardrails.
Patent-Pending Essay Playback™
Reconstructs the drafting process from 1:1 Chromebook Google Docs, Canvas, or Word. Teachers watch a 45-minute lab write-up unfold in 60 seconds at 1x–8x replay.
External Paste Inspector
Archives the raw clipboard payload string at the millisecond of injection—preserving the original LLM prompt even after a student spends 20 minutes rephrasing text.
Cross-Period Peer Matcher
Scans submissions against the school’s private institutional repository to flag cross-period data sharing (Period 1 to Period 5) without exposing student papers publicly.
AP Science Rubric Autograder
Auto-evaluates AP Science Practices 5 & 6 with quote-anchored score suggestions. One-click sync to Canvas SpeedGrader, Buzz, and Google Classroom.
Zero-Retention FERPA / COPPA
Student lab reports and writing telemetry are never used to train public LLM models. Full institutional compliance with strict state and federal student privacy regulations.
High School APES Case Scenarios from the Field
The Urban Retention Pond & The Confabulated Stonefly (11th Grade APES)
Context: An 11th-grade APES class in suburban North Carolina sampled a stormwater retention basin following heavy rain (Turbidity = 75 NTU, DO = 4.2 mg/L). A lab group submitted an immaculate report claiming 18 Plecoptera (Stonefly) nymphs and a pristine Family Biotic Index of 1.8.
The Falsely Accused Soil Horizon Report (12th Grade APES)
Context: A 12th-grade student submitted a 1,200-word soil pedology and percolation lab report. A legacy whole-document AI scanner flagged the submission as 88% AI-Generated due to dense scientific vocabulary (illuviation, cation exchange capacity, hydraulic conductivity).
The Cross-Period Microclimate Data Swap (10th/11th Grade APES)
Context: A sudden thunderstorm cut short Period 4’s outdoor microclimate transect lab. When grading, the teacher noticed Group 3’s solar lux values (12,450 lux at Point 4) matched a submission from Period 1 that morning.
Designing AI-Resilient APES Field Inquiries: Pedagogical Best Practices
High school educators can proactively design field investigations that minimize the temptation to use generative AI while maximizing authentic student engagement:
Reward “Dirty Data” in Rubrics
Explicitly state in the rubric: “Zero macroinvertebrates found = 100% credit if properly justified in the Error Analysis section.” Removing the penalty for imperfect data removes the incentive to fake numbers.
2-Minute Lightning Defenses
Dedicate 15 minutes post-lab to rapid student pairs oral defenses: “What was your most surprising data point in Quadrat 3, and walk me through your Simpson’s Index denominator?” Authentic samplers answer effortlessly in 30 seconds.
Clear Permissible AI Boundaries
Define acceptable vs. unacceptable AI use: Permissible for troubleshooting broken spreadsheet formulas or checking spelling; strictly impermissible for inventing data points or writing CER sections.
Table 3.0: High School Science Department AI Permissibility Matrix
| Lab Phase | Permissible AI Assistance (Authorized) | Impermissible AI Generation (Unauthorized) |
|---|---|---|
| Pre-Lab Planning | Asking AI to explain the chemical mechanism of the Winkler titration method. | Asking AI to write the pre-lab hypothesis and background research. |
| Data Collection | Using mobile sensor apps (Vernier Graphical Analysis, Pasco Sparkvue). | Prompting AI to generate synthetic data tables or replicate trials. |
| Data Analysis (Practice 5) | Using AI to troubleshoot a broken spreadsheet formula (=SUM(...)). |
Asking AI to compute biodiversity indices without showing manual math. |
| CER Argumentation (Practice 6) | Asking AI to check spelling, punctuation, and grammar on drafted text. | Prompting AI to write the Claim, Evidence, and Reasoning sections. |
Frequently Asked Questions (FAQ)
1. How can I prevent high school students from feeling pressured to fake field data when outdoor sampling fails or yields anomalous results?
Reframe the definition of success in scientific inquiry. High school students often conflate “getting clean textbook results” with earning an “A.” At the start of the academic year, explain that real-world ecology is inherently noisy. Design lab rubrics where up to 40% of the grade is allocated to the Error Analysis & Limitations section. When students know that documenting a failed titration, an unexpected zero-count in a kick net, or a rain-disrupted transect can earn 100% credit through rigorous scientific justification, the motivation to generate synthetic AI data disappears.
2. Why do generic whole-document AI detectors flag authentic APES lab reports at such high rates?
Generic AI detectors measure statistical perplexity and burstiness in natural language. Authentic scientific writing is inherently low in burstiness: it relies on standardized sentence starters (“The data supports the claim that...”), precise passive-voice phrasing, and non-negotiable domain vocabulary (eutrophication, benthic macroinvertebrates, Simpson’s Index). Because these words and sentence structures appear frequently in LLM training corpora, generic detectors mistakenly classify rigorous human scientific prose as machine-generated text.
3. How does Checkmark differentiate between legitimate Vernier/Pasco sensor data exports and ChatGPT-generated tables?
Digital sensor interfaces (like Vernier LabQuest or Pasco Capstone) export raw numerical data as comma-separated values (CSV) with standardized hardware header strings, precise microsecond sensor sampling rates, and realistic high-frequency physical noise (sensor jitter). ChatGPT-generated tables lack hardware metadata, feature patterns of unnatural smoothness, and are accompanied by conversational markdown text payloads. Checkmark’s Paste Inspector records the exact clipboard payload and source structure, allowing teachers to verify legitimate sensor exports instantly.
4. Can Essay Playback™ prove a student actually calculated Simpson’s Diversity Index by hand?
Yes. When a student calculates Simpson’s Diversity Index authentically, Essay Playback™ captures the natural human cognitive rhythm: typing the formula heading, pausing for 3 to 6 minutes while performing arithmetic on a handheld calculator, typing intermediate products (n(n-1) values), and making typographical or arithmetic backspace corrections. In contrast, AI-generated submissions inject the complete formula, intermediate steps, and final index value in a single instantaneous paste event.
5. What should an APES teacher do if a student collected real field data but used AI to write the entire CER discussion?
Checkmark’s passage-level analysis will highlight the authentic human data entry in the tables while placing high-confidence AI flags on the narrative CER paragraphs. In a restorative conference, present the Essay Playback™ timeline to the student. Acknowledge and validate their authentic field data collection, then explain that the cognitive value of the course lies in developing their own scientific voice and reasoning skills (AP Science Practice 6). Offer them the opportunity to rewrite the CER section in class or during an advisory period using their raw field sheet for revised credit.
6. How does Checkmark ensure FERPA and COPPA compliance when auditing high school lab reports?
Checkmark is built strictly for K–12 educational compliance. Under Checkmark’s zero-retention architecture, student lab reports, field data sheets, and writing telemetry are never used to train general AI models. All student data is encrypted in transit and at rest, maintaining full compliance with the Family Educational Rights and Privacy Act (FERPA) and the Children’s Online Privacy Protection Act (COPPA).
7. How can high school science department chairs implement this audit protocol across an entire 9–12 department?
Department chairs should start by establishing standardized field sheet procedures across all biology, chemistry, and environmental science courses: (1) Standardize the physical field sheet format with mandatory student role initials; (2) Require a timestamped smartphone photograph of the raw field sheet in Appendix A of every lab submission; (3) Integrate Checkmark with the school’s LMS (Google Classroom, Canvas, Schoology, or Buzz) to enable automated writing telemetry, Essay Playback™, and rubric autograding; and (4) Host a departmental professional development session focusing on using Essay Playback™ to resolve contested lab integrity flags collaboratively and supportively.
Conclusion: Stop Guessing, Start Trusting in High School Science
The ultimate goal of high school science education is not to catch students doing something wrong, but to guide them toward doing authentic science right. In an era where generative AI can invent pristine ecosystems in seconds, the role of the AP Environmental Science educator is more vital than ever: teaching students to observe the real world, embrace its messiness, and defend their conclusions with genuine empirical evidence.
By replacing opaque, punitive AI percentage scores with transparent writing telemetry, physical-to-digital concordance audits, and Checkmark’s patent-pending Essay Playback™, science educators can protect honest student researchers, eliminate false accusations, and foster a classroom culture rooted in genuine scientific inquiry.
Ready to audit lab integrity and streamline AP science grading?
Discover how Checkmark Plagiarism equips high school science departments with patent-pending Essay Playback™, passage-level AI detection, and quote-anchored rubric autograding.
Explore Checkmark Science Solutions →