
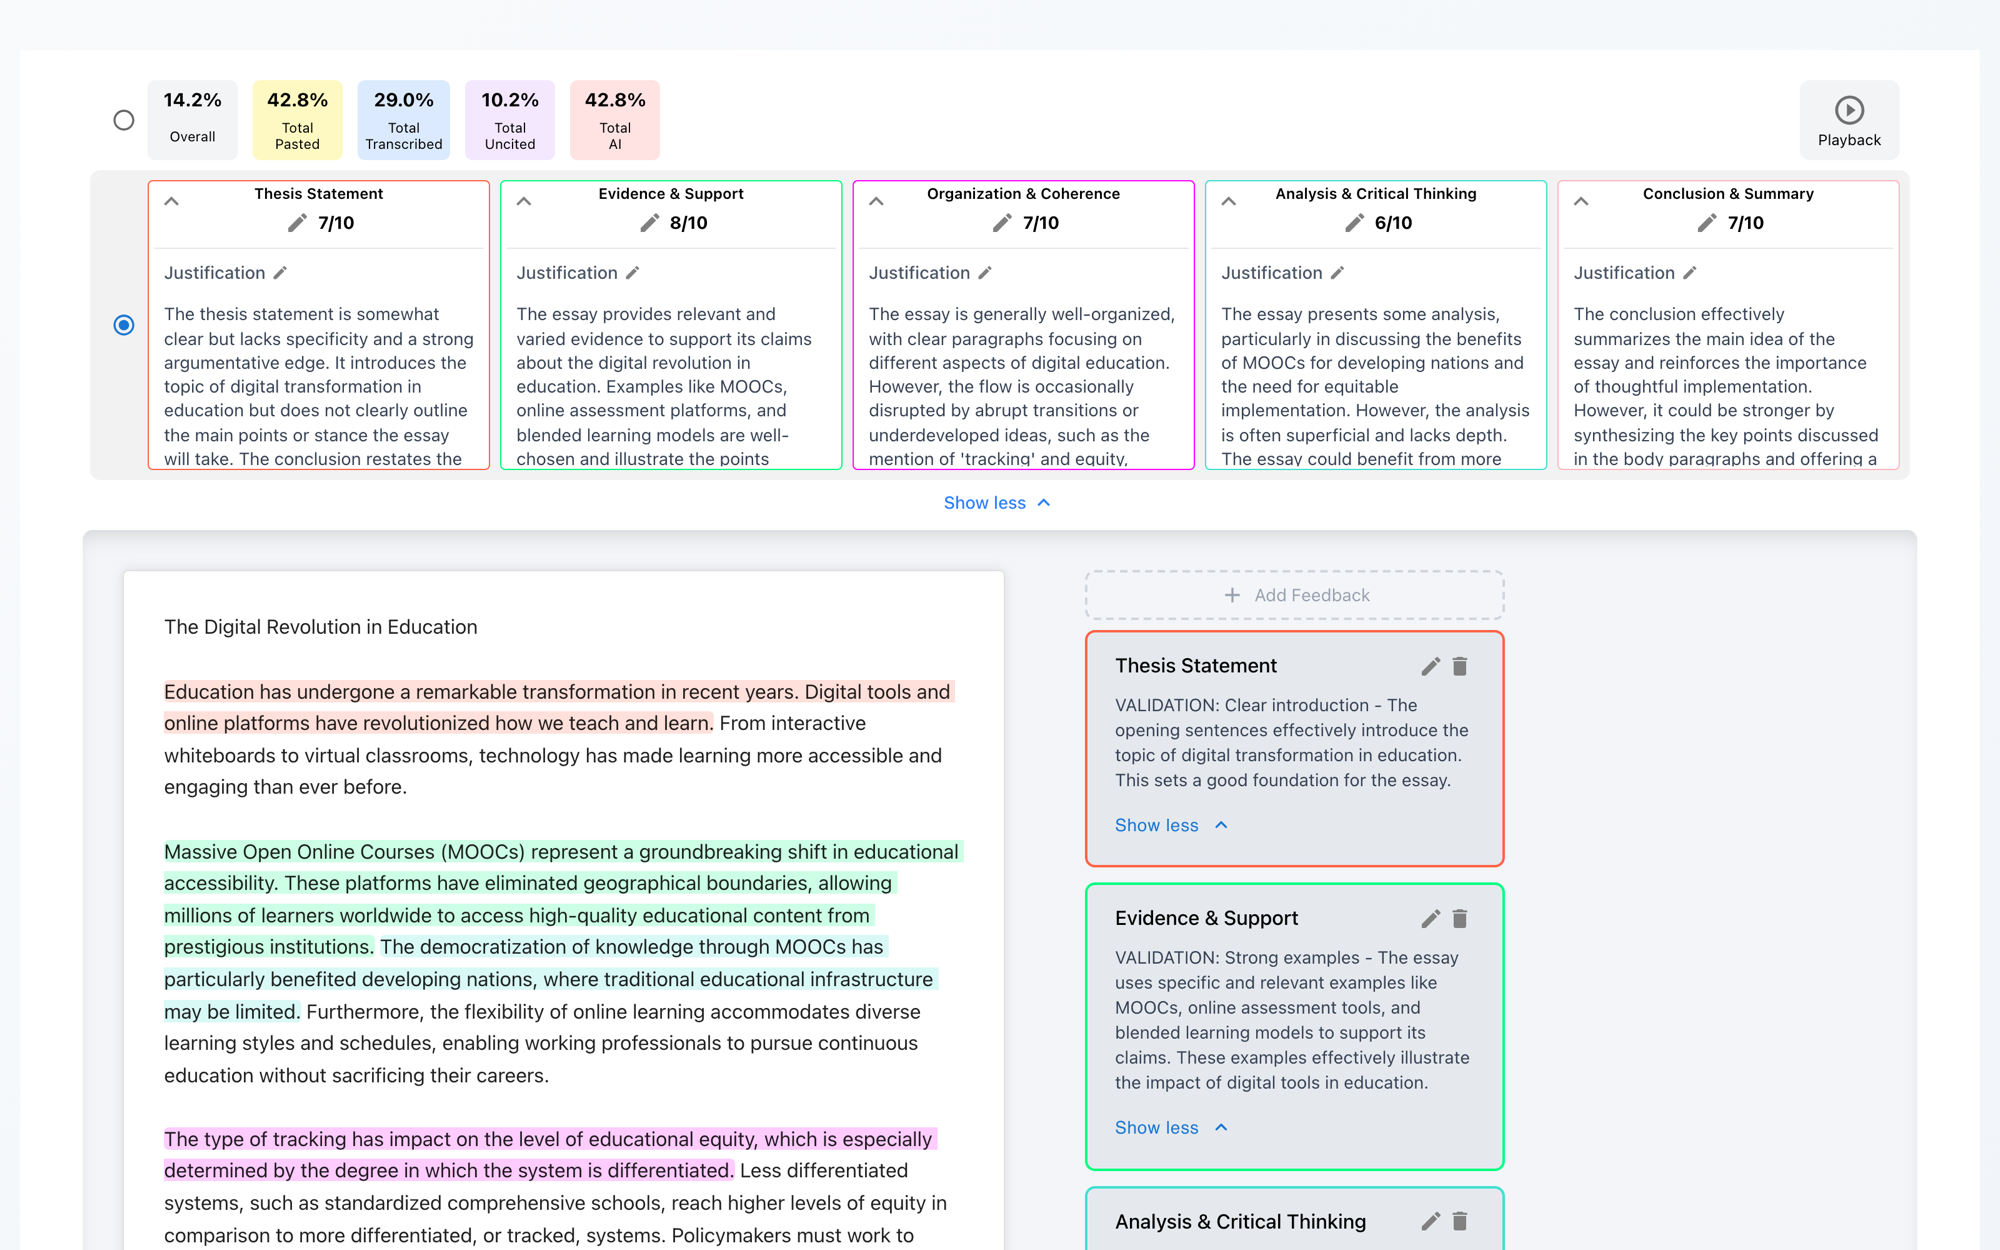
Executive Summary & Pedagogical Context
Evaluating Free-Response Questions (FRQs) in Advanced Placement (AP) Statistics presents one of the most intellectually demanding, pedantic, and time-consuming grading challenges in secondary STEM education. In Unit 2: Exploring Two-Variable Data, student success hinges on exact statistical phrasing, non-deterministic framing, contextual grounding with explicit measurement units, and geometric residual plot reasoning. A student who omits the word "predicted" or "on average" when interpreting the slope of a least-squares regression line (ŷ = a + bx), or who asserts that a high coefficient of determination (r2) proves linearity without examining residual scatter, immediately drops from Essentially Correct (E) to Partially Correct (P) or Incomplete (I) under College Board rubrics.
Generic Large Language Models (LLMs) consistently fail in this domain: they exhibit "hallucinatory leniency," over-rewarding superficial fluency while overlooking deterministic language, missing units, and conflated correlation-causation claims. Conversely, rigid regular expression (RegEx) keyword matchers penalize valid alternative phrasing from English Language Learners (ELLs) while remaining vulnerable to keyword stuffing. This guide demonstrates how specialized semantic statistical autograding combined with Checkmark's patent-pending Essay Playback™ and Writing Telemetry™ delivers rigorous, quote-anchored rubric evaluation, protects against unauthorized AI generation, and eliminates the 15-hour weekend grading bottleneck for high school statistics educators.
AP Statistics Free-Response Exam Architecture & Scoring Taxonomy
Part A: Questions 1–5
65 Minutes (~12 min/FRQ)- Q1: Collecting & Exploring One-Variable Data
- Q2: Bivariate Quantitative Data & Linear Regression Modeling
- Q3–Q5: Probability Distributions, Sampling, & Formal Statistical Inference
- Each FRQ is scored across 3 to 4 distinct sub-parts (Parts a, b, c)
Part B: Question 6
25 Minutes (Investigative Task)- Investigative Task assessing non-routine problem solving & curricular synthesis
- Often introduces advanced bivariate transformations (semi-log, log-log)
- Tests deeper conceptual understanding beyond standard calculator recipes
- Accounts for 25% of the total Free-Response Section score
College Board Sub-Part Scoring Taxonomy
All mathematical components correct; non-deterministic phrasing present; context and units explicitly stated.
Core numerical logic sound, but missing non-deterministic qualifiers ('predicted'), dropped units, or missing context.
Mathematically flawed interpretation, deterministic assertion, or complete omission of required geometric reasoning.
1. The AP Statistics Unit 2 Free-Response Architecture & The High School Grading Bottleneck
In high school Advanced Placement Statistics courses across the United States, Unit 2: Exploring Two-Variable Data (Bivariate Quantitative Data) forms the foundational bridge between descriptive exploratory data analysis and formal inferential modeling. Unlike pure algebraic computation where an equation yields a single numerical answer, AP Statistics demands that students translate mathematical relationships into precise, defensible natural-language statistical justifications.
Σ The 9 Core Conceptual Pillars of AP Statistics Bivariate Linear Regression
LSRL Equation Notation
Must use "hat" (ŷ) notation or explicitly write "Predicted [Response]" to indicate an empirical estimate.
Slope Interpretation (b)
Mandates: For each 1-unit increase in x, the predicted/estimated y increases/decreases by |b| units on average.
y-Intercept Meaning (a)
When x = 0 units, the predicted y is a units. Must assess whether x = 0 is physically meaningful or an extrapolation.
Correlation Coefficient (r)
Requires 3 mandatory descriptors: Direction (pos/neg), Form (linear), and Strength (strong/moderate/weak) in context.
Coeff. of Determination (r2)
Template: Approximately [r2 × 100]% of the variation in [response y] is accounted for by the linear model with [x].
Residual Calculation (ei)
Positive residual = model underestimated (point above line). Negative residual = model overestimated (point below line).
Residual Plot Justifications
Linear model is appropriate iff residual plot displays random scatter around e=0 with no curve, fan shape, or systematic trend.
Residual Std. Dev. (s)
Typical distance between actual observed values of y and predicted values on the LSRL (typical prediction error).
Leverage, Outliers & Influence
High leverage = extreme x-values; Outliers = large residuals; Influential = points whose removal substantially alters slope/intercept.
The Secondary Math Teacher's Grading Arithmetic
A typical AP Statistics educator teaches 5 class sections with ~30 students per section (150 total students). Each Unit 2 Free-Response Exam contains 3 multi-part questions, yielding 1,350 distinct sub-part justifications to evaluate.
Because a single missing word like "predicted" or an omitted measurement unit alters a student's score from Essentially Correct (E) to Partially Correct (P), teachers cannot skim. The result is severe grading fatigue, subjective grading drift across class sections, and delayed feedback cycles that arrive two weeks after the exam.
2. The Autograding & Pedagogical Dilemma: Why Conventional Tech Fails
To appreciate why standard educational software has failed to automate AP Statistics grading, one must examine the opposing failure modes of Generic Large Language Models (LLMs) and Rigid Regular Expression (RegEx) Keyword Matchers.
Hallucinatory Leniency & Context Blindness
- The "Deterministic Phrasing" Blind Spot: When Marcus writes "For every additional 1,000 lbs, fuel economy drops by 0.45 mpg," generic LLMs award 4/4 because the prose is fluent and numerical values are correct. However, College Board mandates Partially Correct (P) because regression lines model predicted averages, not deterministic outcomes.
- The "Missing Measurement Units" Blind Spot: Generic LLMs regularly award full credit to "The typical distance is 3.8," ignoring that omitting "miles per gallon" in context invalidates the response under AP guidelines.
- Visual Grounding Hallucinations: Standard LLMs cannot correlate a student's text against the actual residual scatter plot provided in the prompt, often accepting contradictory claims.
Syntax Inflexibility & ELL Bias
-
Penalizing English Language Learners: When Elena (an ELL student) writes "the dots make one clear curve shape like a bowl, so a straight linear equation is not the right model," a regex engine looking for exact keywords like
random scatter around 0marks her response 0/4 despite perfect statistical reasoning. - Vulnerability to Keyword Stuffing: A student who memorizes buzzwords and writes "The predicted variation in y is accounted for by the random scatter in the residual plot on average" receives full credit from a keyword matcher despite writing meaningless word salad.
- Zero Reasoning Capability: Cannot determine whether a student linked the presence of a pattern to the inappropriateness of the linear model.
3. The High School Statistics Grading Evidentiary Matrix
To establish a defensible, production-ready standard for secondary mathematics departments, we compare the four primary methods of evaluating AP Statistics bivariate regression FRQs across critical pedagogical and technical dimensions.
AP Statistics Free-Response Evaluation Evidentiary Matrix
Comparing manual rubric grading, generic LLMs, keyword matchers, and Checkmark's semantic statistical autograder.
| Evaluation Dimension | 1. Manual AP Scoring | 2. Generic LLM (ChatGPT-4o) | 3. RegEx Keyword Scorer | 4. Checkmark Autograder |
|---|---|---|---|---|
| Non-Deterministic Phrasing | Exact (Catches deterministic prose) | Unreliable (Passes deterministic text) | Inflexible (Fails valid synonyms) | Exact (Flags missing 'predicted/on avg') |
| Context & Measurement Units | Strict human check | Frequent false passes on missing units | High false negatives on unit variants | Rigorous contextual entity extraction |
| Residual Plot Justification Logic | High visual-semantic reasoning | Poor / Hallucinates visual consistency | Zero (Cannot evaluate curvature logic) | Dual-component pattern verification |
| Equity for ELL Students | High (Trained human parses intent) | Moderate (Biased toward verbosity) | Severely Depressed (Penalizes alt syntax) | High (Semantic intent parsed fairly) |
| Grading Time (150 Cohort) | 15.0 – 18.0 Hours | 2.0 – 3.0 Hours (Manual spot checks) | < 1 min (Requires heavy overrides) | < 15 Minutes (Teacher review & sync) |
| Quote-Anchored Feedback | High (When teacher has time) | Vague paragraph summaries | Non-existent (Binary right/wrong) | Precise, clickable evidence cards |
| Authorship & Paste Verification | None (Cannot detect typing bots) | None (Cannot verify authorship) | None (Static text analysis only) | Essay Playback™ Keystroke Replay |
4. Step-by-Step 4-Criterion Statistical Evaluation Protocol for Bivariate Data FRQs
Checkmark Plagiarism's AI Autograder employs a specialized 4-Criterion Statistical Evaluation Protocol calibrated to College Board scoring guidelines. Rather than treating an FRQ response as generic text, the engine parses student writing through four dedicated mathematical and linguistic filters.
Criterion 1: Context & Measurement Units Grounding
The College Board Rule: An interpretation cannot receive full credit without explicitly naming both variables and their corresponding measurement units in the physical scenario.
Criterion 2: Non-Deterministic Predictor Framing
The College Board Rule: High school students must distinguish between deterministic mathematical functions and empirical statistical regression models.
"the predicted [y] increases", "the estimated mean [y] decreases", "we expect [y] to change by", "on average, [y] increases".
"[y] will increase by", "[y] increases exactly by", "the actual [y] goes up by". (Triggers score drop to P).
Criterion 3: Residual Plot Pattern Analysis & Model Appropriateness
The College Board Rule: To earn an Essentially Correct (E) on a residual plot FRQ, the student must satisfy two complete interdependent components:
Explicitly states either a random scatter around residual = 0 OR a distinct curved / systematic pattern.
Concludes whether the linear model is appropriate or inappropriate based directly on that residual scatter.
Criterion 4: Multi-Step Inferential Logic & Terminology Precision
The College Board Rule: Students must never conflate distinct statistical metrics: r (correlation), r2 (variation explained), and s (typical prediction error).
5. Authentic Student Authorship & Writing Telemetry in AP Statistics
While scoring accuracy is vital, high school statistics educators face an equally disruptive challenge in 1:1 Chromebook classrooms: generative AI and digital equation solver fraud. When teachers assign take-home FRQ problem sets or digital classwork via Google Classroom or Canvas, students frequently use tools like ChatGPT, Claude, or specialized math solver bots to generate perfect statistical paragraphs.
Patent-Pending Essay Playback™ Timeline Reconstruction (1x–8x)
1. Keystroke-by-Keystroke Replay
Watch natural calculator pauses, formula edits, and non-deterministic phrasing revisions at 1x–8x playback speeds.
2. Paste Buffer Preservation
Preserves the exact pasted text even if the student subsequently rewords, paraphrases, or deletes parts of the pasted text.
3. Passage-Level Confidence Sliders
Replaces opaque whole-paper percentages with granular sentence-level indicators, visible only to the educator.
6. Concrete High School Classroom Case Studies
The following real-world case studies from high school AP Statistics classrooms illustrate how Checkmark's combined semantic autograding and writing telemetry operate in practice.
11th Grade AP Statistics Unit 2 Exam: The Missing "Predicted" Trap
"Great job! You correctly identified the slope (0.85) and included both units (meters and km/h) in context." (FLAW: Overlooked deterministic phrasing!).
Diagnostic Card: "⚠️ Deterministic Phrasing Detected: The interpretation states that speed increases definitively. On the AP Exam, you must include 'predicted speed' or 'increases by 0.85 km/h on average'."
12th Grade Investigative Task Prep: ELL Student Non-Standard Phrasing
Failed to match rigid strings: "residual plot", "random scatter around 0", or "linear model is inappropriate".
Components Verified: Non-random curve detected ("curve shape going down and up like a bowl") + Correct conclusion that linear model is not appropriate ("straight linear equation is not the right model").
Take-Home Problem Set: AI Chatbot Copy-Paste Flagged by Telemetry
7. Best Practices for Secondary Math Departments & AP Exam Coordinators
To maximize the pedagogical benefits of AI autograding and writing telemetry in high school mathematics, department chairs and STEM leaders should establish clear departmental operational protocols:
Calibrate Rubrics Pre-Unit
Import official College Board scoring guidelines directly into Checkmark from Canvas LMS, Google Classroom, or Agilix Buzz before launching Unit 2.
Maintain Teacher Final Authority
AI scores remain provisional drafts. Teachers use Checkmark's Speed-Review queue to approve or adjust scores in under 10 seconds per student submission.
Restorative Telemetry Coaching
Never accuse students using raw percentage scores. Use objective keystroke replay logs and paste timelines during student conferences.
1-Click Gradebook Sync
Push quote-anchored feedback cards and approved E/P/I scores directly into Canvas SpeedGrader, Buzz, or Google Classroom with one click.
8. Frequently Asked Questions (FAQs)
How does Checkmark differentiate between a student making a mathematical error versus a phrasing error on an AP Statistics FRQ?
Checkmark's semantic statistical autograder evaluates content across distinct rubric criteria. If a student calculates a residual correctly (e = 4.2 - 5.0 = -0.8) but interprets it as "the model overestimated by 0.8" instead of "the actual value is 0.8 below the predicted value," the engine distinguishes numerical calculation accuracy from interpretive reasoning. The system generates granular sub-scores and quote-anchored feedback cards for each dimension.
Why do generic AI detectors produce high false positive rates on AP Statistics definitions?
AP Statistics requires highly formulaic, standardized sentence templates for interpreting slope, y-intercept, r, r2, and s. Because these templates are rigid and repeated thousands of times across the web, generic AI detectors mistake high formulaic predictability for machine generation. Checkmark resolves this by pairing passage-level analysis with Essay Playback™, verifying whether the student typed the formulaic sentence organically keystroke-by-keystroke or pasted it from an external source.
Can Checkmark autograde non-linear transformations and residual plots in Unit 2?
Yes. Checkmark evaluates multi-model comparisons where students must compare linear models against semi-log (log(ŷ) = a + bx) or log-log (log(ŷ) = a + b log(x)) transformations. The engine assesses whether the student correctly identifies which transformation achieved greater linearity, reduced residual curvature, or maximized r2.
How does Checkmark integrate with Canvas SpeedGrader, Agilix Buzz, and Google Classroom?
Checkmark functions as a native LTI 1.3 / API integration within major high school learning management systems. Once an assignment is submitted, Checkmark populates provisional E/P/I scores, criterion justifications, and keystroke telemetry directly within the LMS interface. Teachers can review, edit, and sync finalized grades to the official gradebook with a single click.
Does Checkmark store or train AI models on student AP Statistics FRQs?
No. Checkmark operates under a strict Zero-Data-Retention (ZDR) and zero-model-training architecture. Student submissions and writing telemetry are never used to train commercial AI models. All data is encrypted at rest and in transit, fully compliant with FERPA, COPPA, and state-level student privacy statutes.
How does the system handle students who abbreviate terms or use non-standard notation?
Checkmark recognizes standard mathematical and statistical abbreviations (e.g., LSRL, ei, ŷ, r, r2, se, Δx, mpg, SD). The semantic parser evaluates the contextual role of the abbreviation rather than enforcing a rigid character sequence, ensuring fair evaluation for students who use valid shorthand during fast-paced writing.
Stop Guessing, Start Trusting in AP Statistics
Grading AP Statistics free-response questions no longer requires high school teachers to sacrifice their weekends to repetitive red-pen editing, nor does it require settling for inaccurate generic AI scores. By combining semantic statistical rubric autograding, quote-anchored evidence attribution, and patent-pending Essay Playback™ writing telemetry, Checkmark Plagiarism provides high school mathematics educators with the precision, fairness, and defensibility needed to foster true statistical literacy.