
Executive Summary
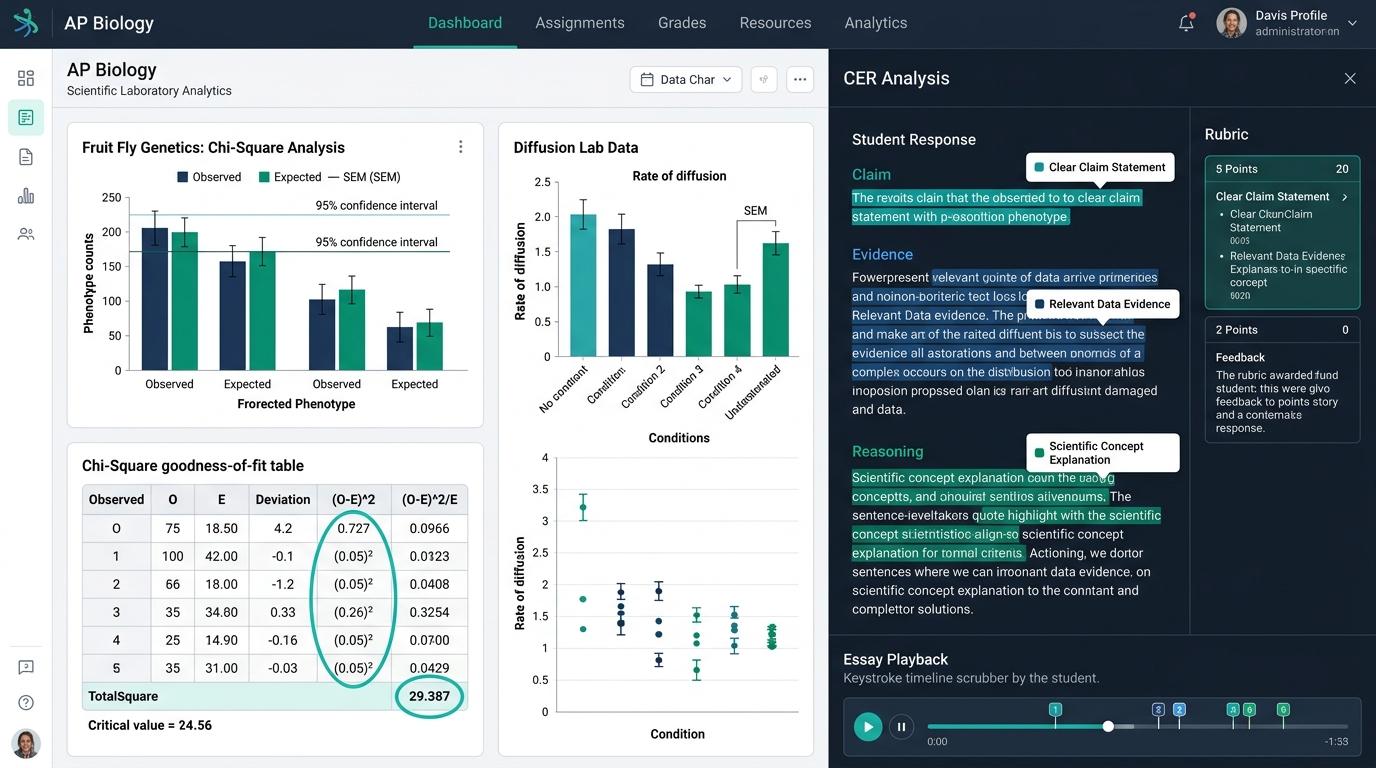
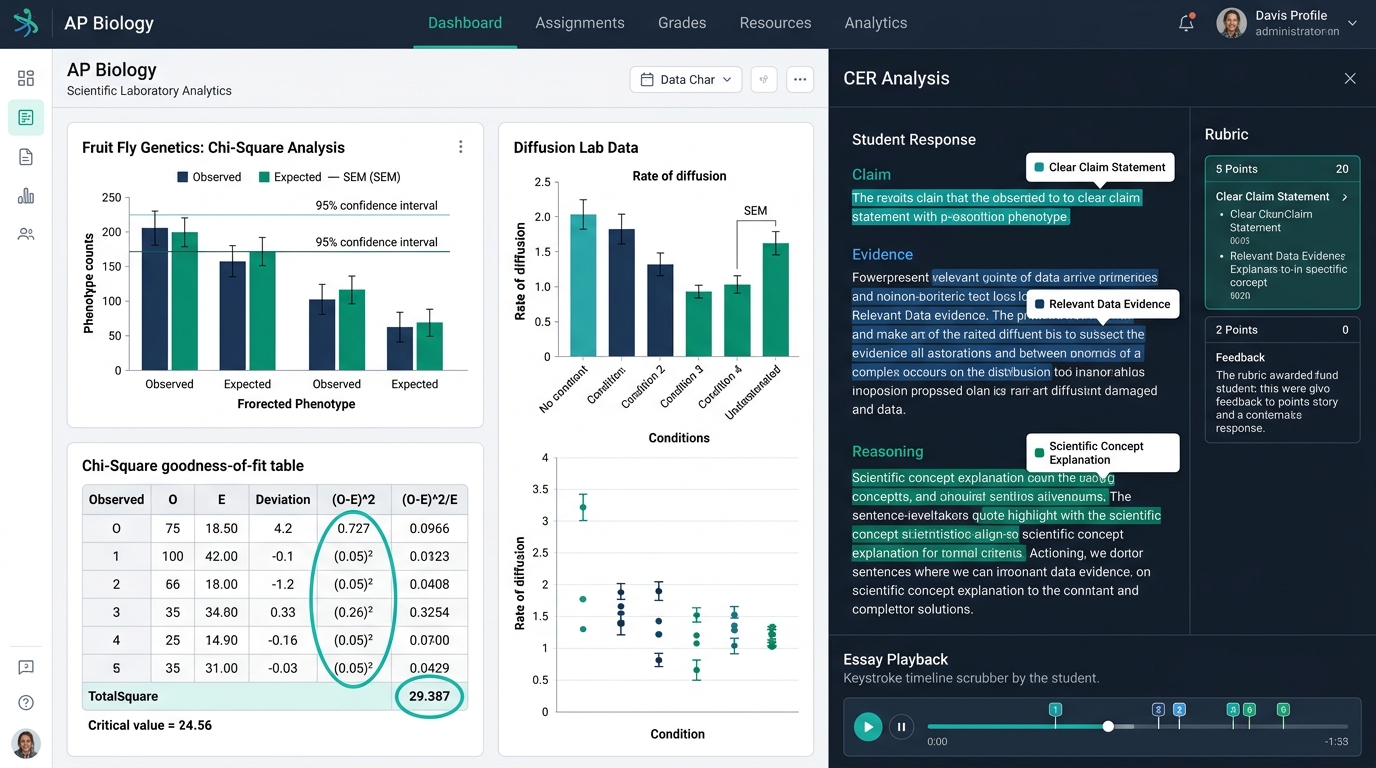
In secondary Advanced Placement (AP) Biology classrooms, quantitative lab investigations represent the core of scientific inquiry—requiring students to synthesize bench data into structured Claim-Evidence-Reasoning (CER) frameworks, calculate Standard Error of the Mean (±2 SEM) error bars, and execute Chi-Square (χ2) goodness-of-fit tests under AP Science Practices 5 and 6. However, the widespread availability of generative Large Language Models (LLMs) has introduced a profound pedagogical crisis: high school students under intense grade pressure routinely prompt AI tools to write their CER conclusions, resulting in statistical confabulation—idealized textbook conclusions unmoored from messy student bench data, fabricated Chi-Square calculations, and hallucinated error bar overlap logic.
Simultaneously, generic commercial AI detectors fail science educators by flagging standard, formulaic scientific terminology (e.g., null hypothesis, degrees of freedom, 95% confidence interval) as “AI-generated,” unfairly penalizing honest students while missing copy-pasted LLM calculations. Checkmark Plagiarism resolves this dilemma by pairing passage-level AI confidence sliders with patent-pending Essay Playback™ writing process telemetry (1x–8x replay), external paste inspection with full text preservation, and quote-anchored AP science rubric autograding. Integrated seamlessly into Canvas SpeedGrader, Agilix Buzz, and Google Classroom, Checkmark equips high school science teachers to verify empirical data concordance, audit mathematical drafting pauses, and conduct supportive, restorative scientific debriefs that cultivate authentic scientific literacy.
1. The Disciplinary Anatomy of AP Biology Quantitative Reasoning
In the high school Advanced Placement Biology curriculum defined by the College Board, scientific literacy transcends rote memorization of cellular pathways or ecological terminology. Instead, collegiate-level biological proficiency is measured through the rigorous execution of the AP Biology Science Practices, specifically the integration of quantitative data analysis and formal argumentation.
Concept Explanation: Explain biological concepts, processes, models, and systems presented in written format.
Visual Representations: Analyze diagrams, flowcharts, cellular pathways, and experimental models.
Questions and Methods: Formulate testable scientific questions and determine appropriate experimental designs.
Representing Data: Construct structured data tables, scatter plots, bar charts, and ±2 SEM error bar graphs.
Statistical Tests: Perform statistical calculations including mean (&bar;x), SD (s), SEM, 95% CI, Chi-Square (χ2), and rate of change.
Argumentation: Develop and justify scientific claims using empirical quantitative evidence and biological reasoning (CER).
When 10th, 11th, and 12th-grade students conduct foundational AP Biology laboratory investigations—such as Lab 1: Artificial Selection, Lab 2: Mathematical Modeling (Hardy-Weinberg), Lab 4: Diffusion and Osmosis, Lab 5: Photosynthesis (Floating Leaf Disk Assay), Lab 6: Cellular Respiration (Respirometers), Lab 7: Mitosis and Meiosis, or Lab 12: Fruit Fly Genetics (Drosophila melanogaster)—they are required to transition from wet-lab bench data collection to formal written argumentation.
The AP Biology Claim-Evidence-Reasoning (CER) Framework
High school science departments across the country rely on the Claim-Evidence-Reasoning (CER) framework to structure student lab write-ups. In AP Biology, this structure requires exact mathematical and empirical precision:
A direct, declarative answer to the research question.
Directly links the independent variable's effect on the dependent variable without ambiguity.
Quantitative data citations and confidence intervals.
Cites sample means (&bar;x), calculated ±2 SEM confidence intervals, rates of change, or χ2 benchmarks (p = 0.05).
Mechanistic biological rationale and statistical rules.
Connects empirical data to biochemical collision theory, metabolic kinetics, genetic inheritance, or error bar overlap rules.
Statistical Mechanics of Error Bars: ±2 SEM and the 95% Confidence Interval
Under AP Science Practice 5, students must master the mathematical derivation and graphical interpretation of the Standard Error of the Mean (SEM) to represent measurement uncertainty and sample variability.
Measures the central tendency and individual sample dispersion across biological trials.
Lower Bound = &bar;x - 2(SEM), Upper Bound = &bar;x + 2(SEM). Used to construct College Board exam error bars.
│
┌──────────┼──────────┐
───┴─── ───┬───
&bar;x - 2(SEM) &bar;x + 2(SEM)
└────────── 95% CI ──────────┘
If repeated samples are drawn, 95% of calculated confidence intervals will encompass the true population mean.
The AP Biology Error Bar Overlap Decision Rule
On the national AP Biology Exam (in Free Response Questions / FRQs) and in classroom lab assessments, the College Board applies a standardized, operational rule for interpreting graphical error bars constructed with ±2 SEM:
Statistically Significant Difference (p < 0.05)
The upper bound of Group A is strictly below the lower bound of Group B (&bar;xA + 2SEMA < &bar;xB - 2SEMB).
- High statistical confidence that the true population means differ.
- Observed difference is unlikely due to random sampling error alone.
- Decision: Reject the null hypothesis (H0).
No Statistically Significant Difference (p ≥ 0.05)
The ±2 SEM error bar range of Group A intersects the error bar range of Group B.
- The researcher fails to reject the null hypothesis (H0).
- Observed differences can plausibly be explained by sampling noise.
- CRITICAL NOTE: Overlap does NOT prove groups are “identical”; it only indicates insufficient evidence of a difference.
Mathematical Mechanics of Chi-Square (χ2) Goodness-of-Fit Tests
In AP Biology genetics, animal behavior (choice chamber taxis/kinesis), and ecology, students execute the Chi-Square (χ2) Goodness-of-Fit Test to evaluate whether observed empirical frequencies deviate significantly from theoretical Mendelian or uniform expectations.
O = Observed counts, E = Expected theoretical counts (Total N × proportion).
k = number of phenotypic classes (e.g., 4 classes in dihybrid cross → df = 3).
χ2calc ≤ χ2crit → Fail to Reject H0
Standard threshold for biological significance is α = 0.05.
| Degrees of Freedom (df) | 1 | 2 | 3 (Dihybrid) | 4 | 5 | 6 | 7 | 8 | 9 |
|---|---|---|---|---|---|---|---|---|---|
| Critical Value (χ2 at p = 0.05) | 3.84 | 5.99 | 7.81 | 9.49 | 11.07 | 12.59 | 14.07 | 15.51 | 16.92 |
2. The LLM Disconnect: How Students Prompt AI for AP Bio CER Lab Reports
When high school students are assigned formal laboratory write-ups in AP Biology, the cognitive leap from wet-lab bench execution to rigorous statistical argumentation is substantial. Facing crowded academic schedules, multiple AP courses, and fear of receiving poor grades for “imperfect” lab results, many students turn to commercial Large Language Models (such as ChatGPT, Claude, or Google Gemini) to generate their CER sections.
However, generative AI models possess fundamental architectural limitations when applied to empirical high school science investigations.
The Anatomy of LLM Confabulation in AP Science Lab Reports
Large Language Models do not possess an empirical sensorium or an active connection to physical reality. When a student enters a prompt such as:
“Write the Claim-Evidence-Reasoning (CER) and Chi-Square analysis for my AP Biology fruit fly lab where we crossed sepia eyes / vestigial wings with wild type flies.”
The LLM does not pause to ask for the student’s actual bench data tally. Instead, it relies on probabilistic token prediction trained on published genetics literature and lab manuals, generating statistically confabulated prose:
Idealized Textbook Ratios
The LLM invents clean 9:3:3:1 ratios (e.g., 562, 187, 188, 63; Total N = 1,000) completely unmoored from the student’s messy bench count (e.g., 41, 14, 11, 2).
Fabricated Chi-Square Calculations
The LLM constructs a mathematically coherent table with fabricated (O - E)2 / E values that do not sum to the actual data recorded in the student’s lab notebook.
Hallucinated Error Bar Logic
The LLM confuses Standard Deviation (s) with SEM, claims overlapping error bars prove “biological identity,” or invents precise p-values without a valid distribution model.
Superficial Sophistication
The LLM weaves high-level vocabulary (“epistatic interaction,” “allosteric modulation”) that sounds collegiate but directly contradicts the experiment’s actual controls.
The “Idealized Textbook Data” Fallacy vs. Messy Wet-Lab Bench Data
In a real high school biology laboratory, wet-lab data is notoriously noisy. In the Drosophila melanogaster genetics lab, high schoolers frequently encounter pupal mortality, escaped flies, and variable scope lighting. A genuine student lab group might count:
- Wild Type (Red/Normal): 62
- Sepia Eyes / Normal Wings: 19
- Red Eyes / Vestigial Wings: 14
- Sepia Eyes / Vestigial Wings: 3
- Total Sample Count (N): 98
Expected Counts (9:3:3:1 ratio with N = 98):
EWT = 98 × (9/16) = 55.125 | ESepia = 98 × (3/16) = 18.375 | EVest = 98 × (3/16) = 18.375 | EDouble = 98 × (1/16) = 6.125
χ2 = 0.857 + 0.021 + 1.042 + 1.595 = 3.515
College Board Interpretation: With df = 4 - 1 = 3, χ2crit = 7.81. Because 3.515 ≤ 7.81, the student fails to reject the null hypothesis (p ≥ 0.05), confirming independent assortment despite messy classroom data.
The AI Confabulation Disconnect: When prompted, an LLM often fabricates an idealized sample size of 1,600 flies with expected counts of 900, 300, 300, 100, or claims that “The Chi-Square value of 14.82 exceeds 7.81, rejecting Mendel’s second law.” When an AP Biology teacher reads the CER, the reasoning sounds collegiate, but the data cited in the text has zero correlation with the data recorded at Lab Bench #4!
3. The Pedagogical & AP Grading Dilemma: Why Generic AI Detectors Fail Science Teachers
High school science teachers faced with stacks of 140+ lab reports often turn to commercial black-box AI detectors in an attempt to police AI usage. However, generic AI detectors (which evaluate whole-document perplexity and burstiness) create severe pedagogical failures in secondary science education.
The False Positive Trap on Standardized Scientific Nomenclature
Scientific writing is inherently formal, structured, and syntactically regular. In AP Biology, educators explicitly teach students to write using standardized sentence frames and precise scientific nomenclature:
- “The purpose of this investigation was to determine...”
- “The null hypothesis states that there is no statistically significant difference between the control group and the experimental treatment.”
- “Because the calculated Chi-Square value (χ2 = 2.14) is less than the critical value (χ2crit = 3.84) at p = 0.05 with 1 degree of freedom, we fail to reject the null hypothesis.”
Standard terms (solute potential, cristae, kinase) are flagged as “machine-generated” due to high statistical frequency.
Rigid CER sentence structures taught by teachers are misinterpreted by detectors as a lack of human “burstiness.”
Safety warnings and lab protocol steps match common web corpora, falsely spiking the detector score.
When an honest 10th-grade honors student writes a meticulous, textbook-compliant CER report, generic detectors frequently assign an “85%–100% Likely AI” score. Falsely accusing an earnest student during a high-stakes parent-teacher conference destroys student-teacher trust and alienates families.
The False Negative Trap and The Empirical Blind Spot
Conversely, when a student copies an LLM-generated statistical analysis and runs it through an AI paraphraser (such as QuillBot or Undetectable AI) or manually tweaks a few adjectives, generic detectors register a low score (e.g., “8% AI”). The teacher receives a false clean bill of health, while authentic scientific reasoning was completely bypassed.
The most critical defect of generic AI detectors is that they only look at text strings in isolation. A probabilistic detector has no ability to answer the core scientific questions:
- Did the student actually spend 35 minutes calculating these χ2 values, or did 400 words appear in 0.4 seconds?
- Do the numbers in the written “Evidence” section match the raw mass measurements recorded in Table 1 on page 2?
- Did the student iteratively draft and revise their biological reasoning, or did they paste an external LLM summary directly into their Google Doc or Canvas LMS editor?
4. The AP Biology Evidentiary Matrix
To evaluate student quantitative reasoning effectively, high school science departments must adopt an evidence-based framework that balances teacher workload, scientific integrity, and student trust.
| Verification Dimension | Traditional Paper Notebook | Generic Black-Box AI Detector | Checkmark Scientific Telemetry |
|---|---|---|---|
| 1. Bench Data Concordance | High in class; paper checks across 150 students take hours. | Zero capability; analyzes text isolated from data tables. | Deterministic concordance audit cross-references raw data with CER prose. |
| 2. Calculation Audit | Manual spot-checking; no temporal proof of work. | Ineffective; cannot detect hallucinated χ2 math. | Identifies cognitive calculation pauses and formula drafting via keystroke telemetry. |
| 3. Copy-Paste Telemetry | N/A (handwritten); take-home write-ups invite copying. | Zero paste tracking; evaluates only static text. | Instant timestamped paste capture; preserves full external text even if reworded. |
| 4. Error Bar Overlap Logic | Evaluated solely on final drawn graphs and text. | Easily fooled by fluent, hallucinated claims. | Distinguishes authentic reasoning with passage-level confidence sliders. |
| 5. False Positive Risk | Zero risk on authentic paper pages. | Severe Danger (35–50% false positive rate). | Negligible Risk: isolates formulaic scientific nomenclature. |
| 6. Exoneration Proof | Incomplete for typed take-home sections. | Zero defensible proof; arbitrary percentages. | 100% Defensible Proof: Essay Playback™ visual replay shows drafting history. |
| 7. Teacher Grading Workload | Extremely slow; 30+ weekend hours. | Slow; creates anxiety and second-guessing. | High Efficiency (70% savings): quote-anchored rubric autograder syncs to LMS. |
| 8. FERPA & Privacy | Physical storage only; no digital archive. | High Risk; tools ingest student work to train models. | Enterprise Compliant: zero student data used for AI model training. |
5. Step-by-Step Science Teacher Audit Protocol for AP Bio CER Lab Reports
When evaluating high school AP Biology lab reports, science teachers need a practical, standardized, and supportive audit protocol. The following four-step framework enables educators to verify authentic student reasoning rapidly while maintaining a positive classroom culture centered on scientific growth.
Concordance Check
Cross-reference raw bench data tables with written CER evidence.
χ2 & SEM Audit
Spot-check sample size N, formula math, degrees of freedom, and error bars.
Playback Telemetry
Launch Essay Playback™ to inspect calculation pauses and paste logs.
Restorative Debrief
Conduct a supportive coaching session focused on scientific mastery.
Step 1: Bench Data & Error Bar Concordance Verification
Before reading the student's written reasoning, conduct an empirical concordance check between the raw data table and the written “Evidence” section:
- Verify Raw Data Provenance: Confirm that sample size (N), raw values (e.g., initial and final mass of potato tubers, or counts of Drosophila phenotypes), and calculated means match the student's assigned lab station. If Student A's table lists potato masses in 0.4 M sucrose as 2.14 g → 1.98 g (-7.5%), but their written CER cites a mean percent change of -18.2%, an empirical disconnect exists.
- Audit Standard Error of the Mean (SEM) Calculation: Check that SEM = s / √n is correctly computed and that graph error bars span &bar;x ± 2(SEM), not raw standard deviation.
- Check the Overlap Claim: Examine whether ±2 SEM error bars overlap between groups and verify that the student correctly identifies overlap as no statistically significant difference (p ≥ 0.05).
Step 2: Chi-Square Table Mathematical Spot-Checks
In genetics and animal behavior labs, execute a rapid three-point mathematical verification of the student's Chi-Square table:
- Check 1: Total Sample N: Sum the observed counts (∑ O). Verify that the expected counts sum to the exact same total (∑ E = ∑ O).
- Check 2: (O - E)2 / E Math: Spot-check one row with a calculator. If O = 62 and E = 55.1, then (62 - 55.1)2 / 55.1 = 47.61 / 55.1 = 0.864. If the student table displays an impossible value (e.g., 8.42), the table was likely generated by an external LLM.
- Check 3: df and p-Value: Ensure df = k - 1. For a 4-phenotype dihybrid cross (k = 4), df = 3 (χ2crit = 7.81). If the student uses df = 4 or cites p = 0.01 when χ2 = 4.2, an ungrounded hallucination is present.
Step 3: Analyzing Keystroke Drafting Sessions with Essay Playback™
When a discrepancy is noted, open Checkmark's Essay Playback™ to review the student's authentic writing process. The telemetry signatures of genuine student scientific calculation versus AI copy-pasting are immediately visible:
- Iterative Keystroke Entry: Characters appear naturally (30–55 WPM) with natural rhythm.
- Calculation Pauses: Temporal gaps of 45–120 seconds while the student checks their calculator or lab notebook.
- Active Revision Cycles: Backspacing, correcting math typos, and rephrasing scientific justifications.
- Sudden Bulk Insertion: 450 words of immaculate CER reasoning appear in a single 0.2-second event.
- Zero Cognitive Pauses: No hesitations between complex statistical values; numbers appear mechanically.
- Monolithic Invariance: Zero backspacing or revisions; accepts exact external output unedited.
Step 4: Conducting Supportive Restorative Scientific Debriefs
In alignment with Checkmark's core philosophy—“Stop guessing, start trusting”—academic integrity investigations in secondary science should never take the form of punitive interrogations. Instead, teachers use writing process evidence as a supportive coaching opportunity:
- Focus on the Scientific Process, Not Accusations: Frame the meeting around scientific data analysis: “Let’s look at your Chi-Square calculation together. Your bench data showed 98 flies, but your CER reasoning discusses 1,600 flies. Let’s walk through how to calculate χ2 using your actual station data.”
- Normalize Experimental Error and “Messy Data”: Reassure the student: “In AP Biology, you never lose points because your flies died or your error bars overlapped. You earn full credit by accurately analyzing whatever data your experiment produced.”
- Use the Playback Timeline as Neutral Evidence: Open the Essay Playback timeline with the student: “I see that this section was pasted in from an outside source at 11:14 PM. What challenges did you run into while trying to explain the ±2 SEM error bars?”
- Assign an Authentic Restorative Revision: Have the student recalculate the SEM or χ2 test at the lab bench, re-draft their CER reasoning in class, and submit the corrected analysis for full mastery credit.
6. How Checkmark Plagiarism Empowers AP Biology Educators & STEM Departments
Checkmark Plagiarism was engineered specifically to solve the high school educator’s dual challenge: managing heavy grading workloads across 120–160 students while maintaining ironclad, defensible academic integrity standards.
Passage-Level AI Confidence Sliders: Eliminating False Positives in Science
Unlike generic detectors that output a single, alarming whole-document percentage (e.g., “78% AI”), Checkmark breaks down the student lab report passage by passage, recognizing that high-frequency phrases (“standard error of the mean,” “water potential,” “osmotic equilibrium”) represent standard academic terminology, not AI generation.
“The null hypothesis states that there is no statistically significant difference between the observed phenotypic counts and the expected 9:3:3:1 Mendelian ratio.”
Patent-Pending Essay Playback™ (1x to 8x Replay)
Reconstructs the complete drafting lifecycle of the student's lab report. High school science teachers can scrub through the entire writing session like a video at 1x, 2x, 4x, or 8x speed across 1:1 Chromebooks, Google Docs, Canvas SpeedGrader, Agilix Buzz, Schoology, and Microsoft Word. Provides 100% indisputable visual evidence of independent authorship to reassure department chairs, administrators, and parents.
External Paste Inspector with Complete Original Text Preservation
Records the exact date, time, and character count of external paste events. Crucially, Checkmark preserves the complete original pasted text even if the student subsequently rewrites, rewords, or deletes portions of the text. One-click “Jump to Playback” navigates the scrubber directly to the exact millisecond the paste occurred.
Quote-Anchored AP Science Rubric Autograder with Teacher Authority
Grading 140 multi-page AP Biology lab write-ups across five class periods takes secondary science teachers between 25 and 35 hours per lab unit. Checkmark's AI Rubric Autograder reduces grading time by up to 70% while elevating scoring consistency across AP Science Practices.
7. Three Real-World High School AP Biology Classroom Case Studies
The following scenarios illustrate how secondary science educators apply Checkmark’s integrated suite to navigate real-world academic integrity and quantitative evaluation challenges.
AP Bio Osmosis & Diffusion Lab — False AI Flag Exonerated via Essay Playback™
The Scenario: Jordan submitted a formal CER lab report on potato core water potential. A generic AI detector flagged Jordan's submission as “89% AI-Generated” due to his strict adherence to the structured CER template and formal terms (“water potential equilibrium,” “osmotic pressure”).
The Investigation: The teacher opened Checkmark. Passage-level sliders revealed that flags were isolated entirely to standard introductory sentence starters and the null hypothesis definition. Launching Essay Playback™ showed Jordan typing for 48 minutes, pausing for 70 seconds to calculate percent mass change, making arithmetic corrections, and manually drafting reasoning with zero external pastes.
AP Bio Genetics Lab — AI-Confabulated Chi-Square Analysis Caught via Paste Inspector
The Scenario: In a Drosophila melanogaster dihybrid cross lab, Lucas submitted an immaculate Chi-Square analysis claiming a sample size of N = 1,200 flies with perfect 9:3:3:1 ratios and χ2 = 1.42. However, the teacher recalled that Lucas's lab station only counted 84 flies due to high larval mortality.
The Investigation: Table 1 in Lucas's report listed 84 flies, but his CER analyzed 1,200 flies. Checkmark's External Paste Inspector caught a 360-word paste block inserted at 11:46 PM. Essay Playback™ confirmed 0 keystrokes of manual drafting in the reasoning section.
AP Bio Photosynthesis Lab — Resolving Flawed Error Bar Overlap Reasoning
The Scenario: In the Floating Leaf Disk Assay, Chloe submitted an authentic, independently typed report. However, in her CER reasoning, she stated: “Because the ±2 SEM error bars for white and blue light overlap, the photosynthetic rates are 100% identical.”
The Evaluation: Checkmark's AI Rubric Autograder evaluated Chloe's submission against AP Science Practice 5 and flagged the statistical error: “Misinterpretation of error bar overlap. Overlapping ±2 SEM bars indicate no statistically significant difference (p ≥ 0.05), but do NOT prove biological identity.”
8. Frequently Asked Questions (FAQ) for High School Science Educators
1. How should AP Biology teachers handle collaborative group lab data versus individual CER write-ups?
In high school science, students typically conduct wet-lab investigations in lab station groups of 3 to 4 peers, sharing identical raw data tables, calculated means, and graph plots. Checkmark Plagiarism distinguishes between shared empirical data and individual written argumentation through peer-matching detection (verifying that prose was not copy-pasted across group members) and Essay Playback™ (confirming independent drafting sessions for each student's biological reasoning).
2. Why do generic AI detectors fail so frequently on AP Biology CER reports?
Generic commercial AI detectors rely on whole-document perplexity and burstiness. AP Biology lab reports inherently exhibit low perplexity because they use standardized disciplinary terminology (“null hypothesis,” “degrees of freedom,” “95% confidence interval”) and rigid CER sentence starters taught in class. Generic tools mistake this formal, structured academic style for machine generation, producing false positive rates exceeding 35–50% on honest student work.
3. What is the difference between Standard Deviation (s) and Standard Error of the Mean (SEM), and how do LLMs confuse them?
Standard Deviation (s) quantifies the dispersion of individual data points around the sample mean (&bar;x), describing biological variation within the sample. Standard Error of the Mean (SEM = s / √n) quantifies the precision of the sample mean as an estimate of the true population mean. Generative AI models frequently use the terms interchangeably or construct error bars using ±2s rather than ±2 SEM, leading to wildly inflated confidence intervals that violate College Board scoring rubrics.
4. How does Essay Playback™ prove a student's calculations are authentic without manual re-grading?
Essay Playback™ displays a chronological keystroke timeline. Authentic quantitative reasoning exhibits distinct behavioral telemetry: pauses of 45 to 120 seconds where the student stops typing to perform arithmetic on a calculator or cross-reference a critical value table, character-by-character entry of statistical values, and backspacing to correct math errors. Conversely, AI generation is characterized by sudden clipboard insertion of multi-paragraph statistical text in less than a second.
5. Can students use AI ethically in an AP Biology laboratory setting?
Yes, when guided by clear departmental policies. Permissible AI use includes using AI as a conceptual tutor to clarify theoretical concepts (e.g., “Explain the biochemical role of KOH in a cellular respiration respirometer”), brainstorm experimental controls, or check grammar. Impermissible use involves prompting an LLM to generate the Claim, Evidence, and Reasoning sections, fabricate bench data, or execute Chi-Square calculations on behalf of the student. Checkmark provides the transparent writing telemetry needed to enforce these boundaries fairly.
6. How does Checkmark ensure student privacy under FERPA and COPPA?
High school student lab submissions, drafts, and telemetry data are protected under strict enterprise-grade privacy safeguards. Checkmark never uses student lab reports, essays, or personal data to train public or proprietary AI models. All data is encrypted in transit (TLS 1.3) and at rest (AES-256), ensuring full compliance with FERPA, COPPA, and district privacy mandates.
7. How does Checkmark integrate with high school Learning Management Systems (LMS)?
Checkmark integrates natively via LTI 1.3 Advantage with major secondary school platforms including Canvas LMS (deep integration inside Canvas SpeedGrader), Agilix Buzz, Schoology, and Google Classroom (with a native Chrome extension for 1:1 Chromebook drafting telemetry).
9. Departmental Implementation Checklist & Conclusion
Conclusion: Moving from Guesswork to Scientific Trust
The goal of Advanced Placement Biology is not merely to prepare high school students for a three-hour national examination, but to cultivate rigorous, evidence-based scientific thinking. When generative AI is used to shortcut data analysis and statistical argumentation, students miss the essential intellectual struggle of interpreting empirical reality.
By pairing passage-level AI confidence sliders, Essay Playback™ writing telemetry, and quote-anchored AP rubric autograding, Checkmark Plagiarism empowers secondary science educators to eliminate false accusations, detect statistical confabulation, cut grading workloads by 70%, and restore authentic scientific inquiry in the 1:1 digital classroom.
Stop guessing, start trusting. Discover how Checkmark Plagiarism transforms high school science education at checkmarkplagiarism.com.