
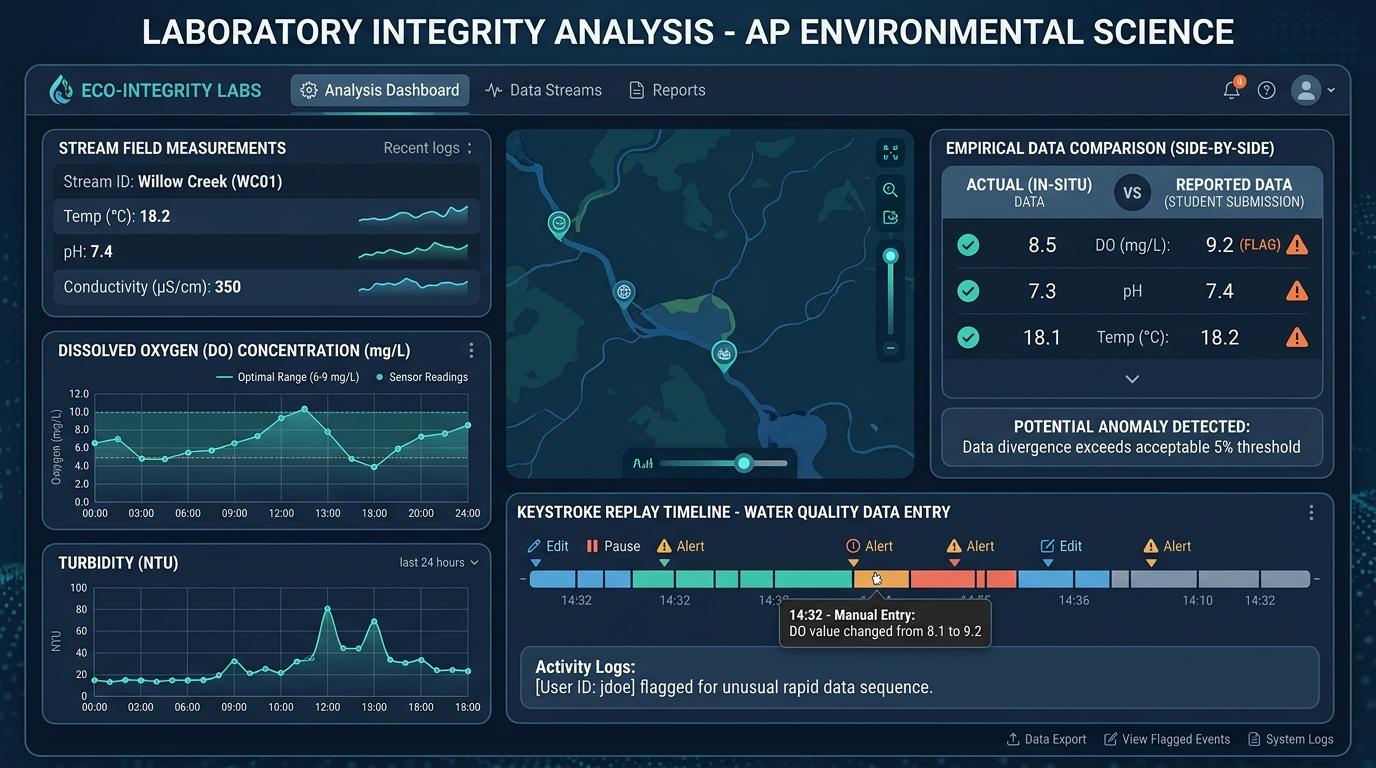
Executive Summary
High school science educators—particularly those teaching Advanced Placement Environmental Science (APES), biology, chemistry, and earth systems—face an insidious form of academic fraud: LLM-synthesized empirical lab data. Rather than conducting labor-intensive field measurements along streams, analyzing soil core horizons, or performing multi-step chemical titrations, students are increasingly prompting Large Language Models (LLMs) to hallucinate pristine data tables, calculate flawless linear regressions (R2 ≈ 1.0), and draft syntactically sophisticated Claim-Evidence-Reasoning (CER) narratives. Conventional plagiarism checkers and generic, black-box AI detectors cannot solve this dilemma; they lack the capability to distinguish between legitimate digital sensor imports (such as Vernier, PASCO, or Google Sheets pastes) and generative text fabrications, and they frequently misidentify authentic lab write-ups containing standard scientific terminology as AI-generated. Checkmark Plagiarism resolves this challenge through an integrated, defensible evidentiary architecture: combining patent-pending Essay Playback™ (scrubbable 1x–8x keystroke-by-keystroke replay of data entry and calculation pauses), 100% immutable clipboard payload inspection (capturing external data drops before student rewrites), passage-level calibrated confidence sliders with honest <150-word short-text guardrails, and teacher-in-the-loop rubric autograding aligned with AP Science Practices and NGSS inquiry standards.
Empirical fieldwork is the foundational pillar of secondary science education. In courses like AP Environmental Science (APES), AP Biology, IB Environmental Systems and Societies (ESS), and Honors Chemistry, fieldwork connects theoretical ecological models to tangible physical realities. When high school students stand knee-deep in a local riparian stream measuring dissolved oxygen, extract core soil samples across an agricultural gradient, or perform acid-base titrations to quantify water alkalinity, they are doing far more than collecting numbers: they are learning the cognitive discipline of scientific inquiry.
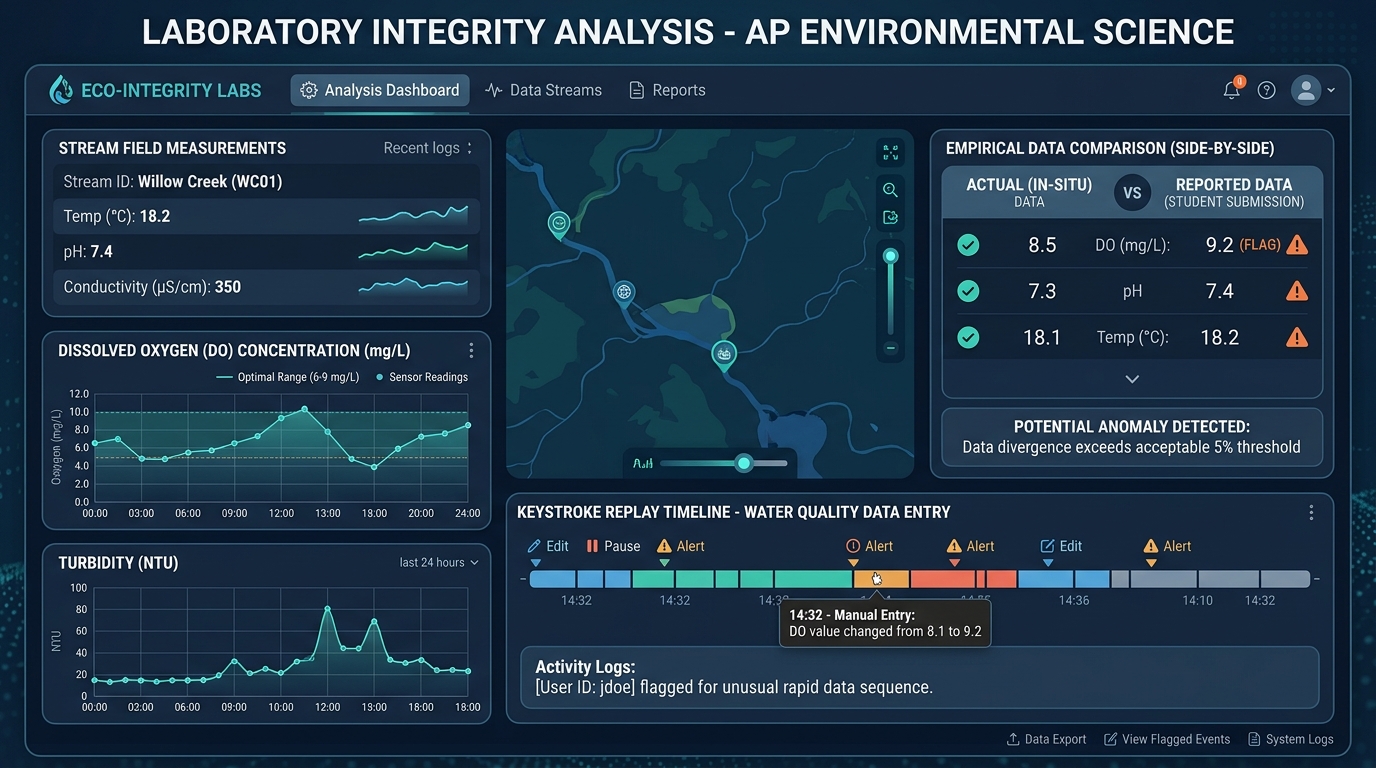
1. The Modern Fieldwork Dilemma: The Rise of AI-Synthesized Environmental Datasets
Authentic scientific inquiry is fundamentally defined by three core cognitive experiences:
- Physical measurement friction: Navigating real-world environmental variables, instrument limitations, ambient weather fluctuations, and sampling errors.
- Representational translation: Converting messy, analog observations into structured quantitative tables, visual scatterplots, and mathematically sound regression models.
- Cognitive reconciliation: Grappling with anomalous data points, calculating percentage error, propagating uncertainty, and constructing evidence-based explanations when results diverge from textbook theory.
However, the democratization of generative AI models (such as GPT-4o, Claude 3.5 Sonnet, and Gemini Pro) has created a profound pedagogical vulnerability: on-demand synthetic data fabrication (“digital dry-labbing”).
- Physical site sampling: Stream mud, ambient rain, cold water shock.
- Sensor calibration & thermal drift: Optical DO probe hydration delay.
- Stochastic variance & human error: Micro-eddies, sediment turbidity spikes.
- Cognitive friction: Reconciling unexpected ecological anomalies in CER.
- Single prompt creation: “Generate APES lab data table for stream DO vs temp...”
- Pristine, noise-free numbers: Perfect linear correlation (R2 = 1.0).
- Instant prose synthesis: 500-word CER discussion generated in 5 seconds.
- Physical disconnect: Hallucinates impossible Henry’s Law saturation values.
From Traditional “Dry-Labbing” to Generative Synthesis
“Dry-labbing”—the fabrication of experimental data without conducting the actual physical experiment—has existed as long as science laboratories. Historically, however, dry-labbing was relatively easy for experienced science educators to catch:
- Students copied tables directly from lab partners, producing identical numbers and typographical mistakes across submissions.
- Students looked up idealized values in textbook appendices, resulting in numbers that were suspiciously round (e.g., exactly 10.0 mL or exactly 25.0°C).
- Students hastily invented random numbers that violated basic physical laws, such as water temperatures freezing at room conditions or dissolved oxygen values exceeding theoretical saturation limits by a factor of ten.
Generative AI has fundamentally changed the nature of lab fabrication. Today, an AP Environmental Science student who skipped a stream-sampling field trip on a cold, rainy Saturday morning does not need to copy a classmate. Instead, they enter a prompt:
“Generate a realistic 10-point environmental field data table for a high school APES stream ecology lab. Include distance downstream from an agricultural runoff pipe (0 to 500 meters), water temperature in Celsius, dissolved oxygen (mg/L), pH, turbidity (NTU), and biological oxygen demand (BOD). Add slight variations so it looks like real student data, and write a 500-word Claim-Evidence-Reasoning analysis explaining the eutrophication curve.”
Within seconds, the LLM produces a beautifully structured Markdown or CSV table. The numbers follow standard limnological principles: as distance from the agricultural pipe increases, dissolved oxygen steadily climbs, turbidity drops, and BOD decreases. The accompanying CER narrative is articulate, employing advanced vocabulary like “photosynthetic oxygenation,” “microbial decomposition kinetics,” and “macrophyte canopy shading.”
When submitted, this synthetic lab report creates a severe pedagogical crisis. If graded solely on the “cleanness” of the data and the grammatical eloquence of the prose, the fabricated report often receives an A, while an honest student who spent three hours in the field battling probe calibration drift, sediment contamination, and fluctuating stream velocity receives a B- due to noisy, imperfect data.
2. Deep Dive: Mechanics of LLM Lab Data Synthesis vs. Authentic Empirical Fieldwork
To reliably distinguish between authentic field data and LLM-synthesized tables, science educators and department chairs must understand the distinct mathematical, thermodynamic, and behavioral signatures left by generative language models across core environmental domains.
Authentic: Non-linear Henry’s Law curve, temperature-dependent saturation limits, probe response lag (30–60s), barometric pressure calibration variance.
Synthetic: Linearized oxygen drops, mathematically impossible supersaturation without algal blooms, zero probe hysteresis or sensor noise.
Authentic: Logarithmic soil buffering, microtopographical moisture shifts, discrete soil ribbon texture transitions, variable percolation rates across distinct soil cores.
Synthetic: Uniform mathematical step-downs (e.g., pH dropping exactly 0.25 per 50m), impossible uniform N-P-K ratios inconsistent with local parent geology.
Authentic: Asymmetric sediment pulses, non-linear inverse relationship between Secchi disk depth (cm) and Nephelometric Turbidity Units (NTU), optical perception variance.
Synthetic: Symmetrical exponential decay, exact mathematical conversion without accounting for organic vs. inorganic particulate optical scattering differences.
Authentic: Asymmetric sigmoidal buffering curves, drop-volume quantization uncertainty (±0.05 mL per drop), human meniscus parallax error, indicator transition lag.
Synthetic: Symmetrically smoothed curves, fractional volume precision exceeding buret tolerances (e.g., reporting 14.333 mL on a 0.1 mL graduated buret).
The Telltale Mathematical and Physical Anomalies of AI-Hallucinated Data
While LLMs are exceptional at generating natural language, their underlying transformer architecture predicts next tokens based on statistical probability distributions rather than computing physical simulations governed by differential equations. Consequently, LLM-generated scientific datasets contain recognizable mathematical and physical anomalies.
1. Zero Stochastic Measurement Noise and Unnatural Smoothness
Authentic environmental field measurements are inherently stochastic. When taking repetitive dissolved oxygen measurements across a 10-meter stream reach, natural micro-eddies, organic debris, sensor membrane drift, and fluctuating stream velocity produce small, random measurement variances (e.g., 6.42 mg/L, 6.38 mg/L, 6.49 mg/L, 6.41 mg/L).
LLMs, even when explicitly prompted to “add realistic variation,” almost always generate data that is either:
- Over-smoothed: Perfectly linear or polynomial progressions with residuals approaching zero (R2 > 0.995).
- Artificially randomized: Adding uniform pseudo-random noise (e.g., randomly alternating ±0.1) that fails to reflect the true physical distribution of environmental noise (which typically follows Gaussian or log-normal distributions).
2. Impossible Stoichiometric and Thermodynamic Contradictions
LLMs frequently hallucinate numbers that sound plausible in isolation but violate physical chemistry and environmental thermodynamics when combined:
- Henry’s Law & Dissolved Oxygen Saturation: At a water temperature of 25°C and standard atmospheric pressure (1 atm), the theoretical saturation concentration of dissolved oxygen in freshwater is approximately 8.26 mg/L. LLMs frequently generate stream tables where water at 26°C is assigned a dissolved oxygen concentration of 11.5 mg/L in an oligotrophic, non-algal stream—a thermodynamic impossibility representing nearly 140% saturation without hyper-photosynthetic bloom conditions.
- Carbonate Buffer & pH Mismatches: In water alkalinity titrations, the relationship between pH, bicarbonate (HCO3−), carbonate (CO32−), and free carbon dioxide (CO2) is strictly dictated by equilibrium constants (Ka1 and Ka2). LLM-generated tables frequently report high free CO2 concentrations alongside alkaline pH values (> 8.5), completely ignoring the carbonic acid equilibrium.
3. Uniform Linear Stepping vs. Environmental Non-Linearity
Natural environmental gradients rarely change at constant linear rates. In a soil transect extending away from an agricultural fertilizer application, nutrient concentrations and soil microbial activity change non-linearly due to soil percolation thresholds, organic matter binding capacity, and microtopography.
LLMs, however, tend to generate predictable arithmetic sequences:
4. Significant Figure Violations and Instrument Resolution Mismatches
Every physical field instrument has a defined measurement resolution:
- Standard high school dissolved oxygen probes (e.g., Vernier Optical DO or galvanic probes) have a precision of ±0.1 to 0.2 mg/L.
- Student Secchi disks are marked in 1.0 cm or 0.5 cm increments.
- High school soil test kits (colorimetric comparator tubes) output discrete categorical ranges or whole integer values.
- Digital benchtop pH pens typically resolve to 0.1 pH units (or ±0.02 pH for calibrated lab electrodes).
LLMs regularly output numbers with arbitrary or excessive decimal precision (e.g., listing turbidity as 14.3827 NTU or soil moisture as 22.489%), reflecting standard floating-point output rather than physical instrument limitations. Conversely, LLMs sometimes round all values to neat single integers, ignoring the specific decimal place required by the lab protocol.
3. The Pedagogical Dilemma: Rewarding Fraudulent Precision vs. Supporting Messy Authentic Science
The rise of LLM-synthesized lab data has exposed a dangerous structural flaw in secondary STEM assessment: the grading bias toward “clean” data.
- Spends 2 hours collecting stream water samples in the rain.
- Optical probe gets fouled by river silt; DO readings fluctuate noisily.
- Discussion struggles to reconcile outlier data points.
“Data was messy; regression line weak; error analysis showed high uncertainty.”
- Prompts ChatGPT in bedroom the night before (5 minutes).
- Synthetic data matches theoretical model perfectly (R2 = 0.998).
- Eloquently phrased CER prose using publication-grade syntax.
“Exceptional data clarity! Flawless linear trends and sophisticated scientific syntax.”
The Destructive Impact on Student Science Mindsets
When high school science rubrics heavily weight whether student results “match the expected theoretical curve,” students receive a toxic pedagogical message: real science is about getting the ‘right’ answer, and messy data is a failure.
This creates an intense psychological incentive to dry-lab:
- Fear of Point Deductions: High school seniors competing for competitive college admissions or AP score boosts believe an outlier in their stream data will cost them valuable rubric points.
- Time Poverty: Juggling multiple AP courses, extracurriculars, and varsity sports, students view re-running a failed lab or troubleshooting an uncalibrated probe as an inefficient use of time when an LLM can synthesize a “perfect” dataset in seconds.
- Erosion of Scientific Resilience: Students never learn that history’s greatest scientific breakthroughs—from Alexander Fleming’s discovery of penicillin to the discovery of cosmic microwave background radiation—arose from investigating unexpected anomalies, not from discarding them.
The Catastrophic Risk of False Accusations
Conversely, educators must avoid the dangerous temptation to accuse any student with unusual data of academic dishonesty. A student whose stream temperature data fails to correlate with dissolved oxygen may simply have:
- Held the temperature probe in direct sunlight while the DO probe remained submerged in a shaded eddy.
- Failed to let the optical DO probe equilibrate in the water long enough before recording a reading.
- Introduced air bubbles into a Winkler titration sample vial during field reagent addition.
- Transcribed numbers from a wet, rain-soaked field notebook into their digital document with accidental typographical errors.
Accusing a well-meaning student of AI fabrication based solely on messy lab results destroys teacher-student trust and discourages budding scientists. Science educators need objective, behavioral evidence (“receipts”) that separates genuine human struggle from artificial generation.
4. The Science Lab Evidentiary Matrix: Comparing Detection Approaches
To establish defensible academic integrity protocols in high school science departments, educators must evaluate the strengths and limitations of different auditing methodologies.
Science Lab Integrity Evidentiary Matrix
Comparing legacy detection tools against Checkmark Plagiarism’s writing process telemetry.
| Feature / Dimension | Generic Black-Box AI Detectors | Manual Spreadsheet Auditing | Checkmark Plagiarism & Essay Playback™ |
|---|---|---|---|
| Primary Detection Vector | Whole-document probabilistic token perplexity and burstiness. | Manual mathematical formula checks, R2 recalculations, anomaly review. | Multidimensional: Keystroke telemetry, clipboard capture, passage AI sliders, source matching. |
| Handling Sensor Data Pastes (Vernier/PASCO/Excel) | ❌ High False Positives: Flags raw numerical tables and lab protocols as AI text. | ⚠️ Time-Intensive: Teacher must manually check whether numbers match sensor exports. | ✅ Intelligent Clipboard Forensics: Preserves and logs exact sensor CSV/table pastes with zero false flags. |
| Catching “Dry-Labbing” & Data Fabrication | ❌ Completely Blind: Cannot detect when data tables are mathematically simulated or disconnected. | ✅ Effective for Obvious Errors: Catches R2 = 1.0 or Henry’s Law violations if teacher has time. | ✅ 100% Provenance Verification: Exposes instantaneous external table drops and lack of drafting pauses. |
| Resilience to Text Humanizers & Paraphrasers | ❌ Vulnerable: Bypassed when students run AI text through QuillBot or Undetectable AI. | ➖ Not Applicable: Spreadsheet audits only inspect numbers, not prose synthesis. | ✅ Immune: Keystroke telemetry captures temporal writing dynamics that humanizers cannot fake. |
| Short-Text Analysis Guardrails (<150 words) | ❌ Unreliable: Guesses on short answers, yielding high false-positive rates on lab abstracts. | ➖ Not Applicable. | ✅ Honest Guardrails: Displays N/A for text blocks below ~150 words to prevent unwarranted flags. |
| Rubric Autograding & LMS Integration | ❌ None: Standalone detector with no grading functionality. | ❌ None: Manual spreadsheet calculations outside the LMS. | ✅ Integrated: Quote-anchored rubric autograding with direct passback to Canvas, Buzz LMS, and Google Classroom. |
| Student Privacy & FERPA Compliance | ⚠️ Questionable: Retains student lab reports to train commercial LLMs. | ✅ High: Local manual teacher spreadsheet review. | ✅ Enterprise-Grade: Zero model training on student submissions; FERPA & COPPA compliant. |
5. Real Classroom Case Scenarios: Fieldwork Forensics in Action
The following three realistic secondary science scenarios illustrate how Checkmark Plagiarism’s writing process telemetry, clipboard inspection, and passage-level AI detection resolve complex academic integrity dilemmas.
Generative Dry-Labbing
Student submits R2 = 0.999 DO curve with impossible Henry’s Law saturation at 28.4°C. Clipboard inspector reveals external ChatGPT table paste.
Hybrid CER Synthesis
Student collects authentic messy soil data, panics over an anomalous phosphate spike, and uses an LLM to generate a synthetic CER conclusion.
Sensor Drift Exoneration
Malfunctioning pH probe flags at 84% AI on legacy checker. Essay Playback proves 55 min of organic drafting, exonerating the student.
Scenario 1: The APES Riparian Stream Study (Generative Dry-Labbing)
The Context: An AP Environmental Science class conducts an all-day field study assessing water quality along a four-kilometer stream corridor receiving runoff from a local dairy farm and a municipal wastewater treatment plant. Students measure water temperature, dissolved oxygen (using Vernier Optical DO probes), pH, and conductivity across six sampling stations.
The Submission: Marcus submits a 1,200-word formal lab report featuring a pristine six-station data table. His dissolved oxygen values exhibit a mathematically perfect inverse linear relationship with water temperature (R2 = 0.9992). However, at Station 4 (a slow-moving, unshaded pool with a water temperature of 28.4°C), Marcus reports a dissolved oxygen concentration of 10.8 mg/L.
- Thermodynamic Anomaly: At 28.4°C, theoretical oxygen saturation is only 7.78 mg/L. Marcus’s 10.8 mg/L represents 138.8% saturation in a turbid pool—a thermodynamic impossibility.
- Clipboard Inspector: At timestamp
23:14:02, Marcus pasted an entire 850-character Markdown table in a single 0.0-second event. Preserved prompt payload shows exact output formatting from Claude. - Essay Playback™ Scrubbing: Marcus spent 4 minutes formatting table headers and immediately pasted a 450-word CER discussion block without a single calculation pause or formula revision.
Scenario 2: The Soil Horizon & Agricultural Runoff Titration (Hybrid Synthesis)
The Context: An Honors Biology class completes a unit on terrestrial biogeochemical cycles. Students take soil core samples at three distinct landscape positions (ridge crest, mid-slope, and riparian floodplain) and perform LaMotte soil nutrient tests for Nitrogen (N), Phosphorus (P), and Potassium (K), alongside soil texture ribbon tests.
The Submission: Elena submits a comprehensive soil report. Her raw data table contains realistic, messy numbers: Nitrogen is low on the ridge (4 ppm) and moderate in the floodplain (18 ppm). However, her phosphorus reading on the mid-slope exhibits an extreme, unexplained spike (85 ppm vs. a baseline of 12 ppm). Her Claim-Evidence-Reasoning (CER) section is written in flawlessly elevated prose, using advanced geochemical terminology to explain away the spike with textbook concepts of orthophosphate mineral adsorption kinetics.
- Passage AI Sliders: Raw data table and methodology evaluated as Typical Human Writing Style (confidence: 94% human). Paragraphs 2 and 3 of the CER discussion flagged as Typical AI Pattern (confidence: 92% AI).
- Essay Playback™ Scrubbing: Minutes 0:00 to 38:00 show authentic typing with frequent backspacing as Elena transcribed physical field notes. At minute 39:15, she highlighted the anomalous phosphorus reading, paused for 3 minutes (external tab switch), and pasted a 320-word explanation directly into the CER section.
Scenario 3: The Sensor Drift Exoneration (Protecting the Honest Student)
The Context: A chemistry student, Sarah, performs a multi-point acid-base neutralization titration to determine the acetic acid concentration in commercial vinegar. During the lab, her Vernier digital pH electrode experiences severe calibration drift due to an aged glass junction, producing an asymmetrical titration curve with an abnormal equivalence point inflection.
The Submission & Dilemma: Sarah writes a meticulous 1,500-word lab report detailing the chemical mechanics of electrode junction fouling, citing specific textbook definitions of the Nernst equation and reference junction potentials. When submitted through a legacy black-box AI detector, Sarah’s report receives an alarming 78% AI Probability score because her error analysis uses formal, predictable scientific syntax.
- 58 Minutes of Continuous Composition: Replay reveals continuous, organic drafting with 25–45s cognitive calculation pauses before typing each formula (CH3COOH + NaOH → CH3COONa + H2O).
- Formula Subscripts & Significant Figures: Sarah repeatedly opened the equation editor, corrected subscripts, deleted rounding errors, and adjusted significant figures.
- Zero External Text Pastes: The Clipboard Inspector showed zero prose pastes; the only pasted items were two raw numerical columns exported directly from Vernier Graphical Analysis.
6. Step-by-Step Science Teacher Audit Protocol
To standardize empirical integrity across secondary science departments, instructional leads and curriculum directors can implement this structured, five-stage audit protocol.
Cross-reference digital lab reports against timestamped physical field notebooks, geotagged site photographs, or raw sensor export files (.csv, .gmbl, .qmbl). In group lab settings, verify that all lab partners share the same foundational raw numerical dataset.
Scrutinize regression coefficients (flag R2 > 0.998 in outdoor field ecology). Check physical laws against standard tables (Henry’s Law dissolved oxygen saturation, stoichiometric balances, pH buffering limits). Verify significant figures match actual physical instrument resolutions.
Scrub through Checkmark’s Essay Playback™ timeline at 2x to 4x speed. Look for natural 15- to 60-second cognitive calculation pauses before analytical claims. Watch how chemical formulas and equations are constructed, and verify non-linear cursor travel between data tables and CER analysis prose.
Inspect raw clipboard captures in Checkmark’s Paste Inspector. Differentiate legitimate sensor CSV table drops from external LLM prompt responses. Review the original pasted text preserved even if the student subsequently spent 20 minutes rewriting words.
Conduct a restorative, non-adversarial conference using objective telemetry receipts. Frame the discussion around scientific inquiry rather than moral accusation: “You don’t lose points in AP Environmental Science when your stream data is messy. You lose points when you fake clean data and miss the opportunity to explain real environmental variables.”
7. How Checkmark Plagiarism Empowers Secondary Science Faculty & STEM Departments
Checkmark Plagiarism is engineered specifically to meet the rigorous evidentiary and pedagogical demands of modern secondary and collegiate STEM education.
- Keystroke-by-keystroke video replay (1x to 8x speed)
- Visualizes cognitive calculation pause rhythms
- Distinguishes organic typing from mechanical retyping
- Integrates directly with Google Docs, Word, & Canvas
- 100% immutable clipboard capture of raw payloads
- Preserves original text even after student paraphrases
- Differentiates CSV sensor tables from LLM prose blocks
- 1-click “Jump-to-Playback” synchronization
- Calibrated confidence sliders on highlighted passages
- Honest short-text (<150w)
N/Aguardrails - Protects formulaic Materials & Methods sections
- Immune to surface paraphrasers (QuillBot / Undetectable)
- NGSS & AP Science Practices rubric alignment
- Quote-anchored feedback cards defending scores
- Teacher retains 100% review and approval control
- 1-click grade passback to Canvas, Buzz LMS, & Google Classroom
1. Patent-Pending Essay Playback™ (Keystroke-by-Keystroke Video Replay)
Checkmark captures the granular temporal mechanics of the writing process directly within Google Docs, Microsoft Word, and LMS text editors (Canvas, Buzz). Science teachers can scrub through the entire writing session at 1x, 2x, 4x, or 8x speed to observe:
- The Rhythm of Quantitative Thinking: Authentic students type, pause to calculate, backspace, correct significant figures, and re-read their prose.
- Equation and Table Formatting: Watch students organically construct tables and chemical equations, providing incontrovertible proof of genuine human effort.
- Transcription Detection: Identifies unnatural, mechanical typing at continuous 65+ WPM without natural composing pauses (such as when a student manually retypes AI-generated lab text while reading off a smartphone or secondary monitor).
2. External Paste Inspector with 100% Immutable Text Preservation
When students import raw data from Vernier Graphical Analysis, PASCO Capstone, or Google Sheets, Checkmark’s paste inspector logs the exact data payload and timestamps the event. Crucially, if a student pastes an LLM-generated analysis and subsequently modifies words to evade detection, Checkmark preserves the exact original clipboard contents, complete with a “Jump-to-Playback” button that takes the teacher directly to the precise moment of insertion.
3. Passage-Level Granularity with Calibrated Sliders & Short-Text Guardrails
Instead of generating an opaque, unhelpful whole-document percentage (e.g., “47% AI”), Checkmark underlines specific passages directly within the lab report. Each flagged segment is accompanied by an individual evidence card featuring a calibrated confidence slider comparing typical human writing dynamics against typical AI patterns. Furthermore, Checkmark includes honest short-text guardrails: any analytical response under ~150 words displays N/A, preventing the rampant false-positive flags that plague legacy checkers on short lab questions.
4. Quote-Anchored Rubric Autograding with LMS Grade Passback
Checkmark accelerates science grading by providing teacher-in-the-loop rubric evaluations:
- Alignment with Science Standards: Autogrades lab reports against custom rubrics aligned with Next Generation Science Standards (NGSS) and AP Science Practices, evaluating Claim-Evidence-Reasoning (CER) structure, data synthesis, and error analysis.
- Quote-Anchored Justifications: Every suggested rubric score is tied directly to highlighted excerpts from the student’s prose, giving teachers defensible grading rationales.
- Teacher Authority & LMS Passback: All AI grades remain drafts until reviewed, modified, and approved by the educator. Once finalized, scores and formative feedback sync directly back into Canvas LMS, Buzz LMS, or Google Classroom gradebooks with a single click.
5. Enterprise Data Privacy & FERPA/COPPA Compliance
Secondary school districts and science departments must protect student intellectual property and privacy. Checkmark guarantees zero model training on student submissions: student lab reports, field measurements, and drafts are never retained to train public or commercial AI models. With end-to-end encryption and full FERPA/COPPA compliance, Checkmark provides a secure integrity infrastructure for K-12 and higher education institutions.
8. Model Science Department Syllabus Policies & Restorative Conferencing Scripts
To establish clear expectations and foster a culture of empirical honesty, science departments should incorporate transparent policy language into course syllabi and lab manuals.
Model Syllabus Policy: AP Environmental Science & Secondary Lab Courses
Secondary STEM PolicyCourse Policy — AP Environmental Science / AP Biology / Chemistry
- Empirical Integrity Principle: Science is the pursuit of truth through physical observation. Laboratory reports must represent the authentic measurements collected by your group. Fabricating data (“dry labbing”) or using generative AI to hallucinate results is a violation of academic integrity.
- Messy Data Receives Full Credit: You are graded on your ability to reason scientifically, analyze uncertainty, and explain anomalies—not on whether your data matches theoretical perfection. An honest report explaining why dissolved oxygen was lower than expected will receive a higher grade than a fabricated dataset with perfect linear trends.
- Collaboration vs. Independent Writing: Lab partners share identical raw data tables. However, all Claim-Evidence-Reasoning (CER) narratives, error analyses, and discussions must be drafted independently.
- Writing Telemetry Verification: Assignments are submitted through Checkmark Plagiarism. Checkmark logs writing telemetry, calculation pauses, and clipboard events via Essay Playback™. In the event of data discrepancies, your playback serves as objective proof of your authentic investigative process.
Restorative Teacher-Student Script: The “Synthetic Stream Data” Conference
APES Fieldwork AuditTeacher: “Hi Marcus. Thanks for meeting with me today. I was reviewing your stream water quality lab report, and I noticed that your dissolved oxygen curve at Station 4 shows 10.8 mg/L at a water temperature of 28.4°C. Let's pull up the Henry’s Law saturation chart on the screen together.”
Student: “Okay... is something wrong with the numbers?”
Teacher: “At 28.4°C, pure water can only hold about 7.78 mg/L of dissolved oxygen at standard pressure. Your reading of 10.8 mg/L would mean the water was nearly 140% saturated, which doesn't occur in a slow-moving, non-algal pool. When we look at Checkmark’s Essay Playback, we see that this data table and the entire CER discussion appeared in a single paste event from your clipboard at 11:14 PM. Can you walk me through how you completed this lab?”
Student: [Pauses] “I missed the Saturday field trip because of a soccer tournament. I didn't want to get a zero, so I asked ChatGPT to make up realistic stream data and write the analysis.”
Teacher: “I appreciate your honesty. In AP Environmental Science, when you miss fieldwork, the right step is to request a peer group's raw data or perform a makeup sampling session. Fabricating data deprives you of learning real limnological dynamics. Here is our plan: I'm going to give you a set of authentic, messy stream data collected by Group 3. You'll plot the real points, calculate the actual percent saturation, explain why their turbidity spiked at Station 2, and write your own CER discussion for full revision credit.”
9. Frequently Asked Questions (FAQ)
1. How does Checkmark differentiate between a student pasting legitimate Vernier/Excel sensor data and pasting an LLM-generated table?
Checkmark’s External Paste Inspector analyzes the structure and formatting of clipboard payloads. When a student exports data from sensor software like Vernier Graphical Analysis, LoggerPro, PASCO Capstone, or Google Sheets, the payload contains specific tab-delimited, CSV, or structured spreadsheet formatting. Furthermore, Checkmark pairs the paste event with subsequent writing telemetry: after pasting raw sensor data, an authentic student exhibits non-linear drafting behavior—pausing to inspect the numbers, typing analytical paragraphs, and referencing specific cell coordinates. When an LLM table is pasted, it is typically accompanied by instant, unedited CER prose blocks with zero subsequent drafting friction.
2. Can students bypass Essay Playback™ by manually retyping AI-generated lab text from a phone or second screen?
No. Checkmark’s writing telemetry specifically identifies manual transcription dynamics. When a student composes authentically, their typing is characterized by variable Inter-Key Intervals (IKI), burstiness, natural cognitive pauses (15–60 seconds) during sentence formulation, and frequent backspacing to revise thoughts. When a student transcribes pre-generated text from a secondary screen, their keystroke velocity is unnaturally steady, mechanical, and continuous (e.g., maintaining a constant 60–75 WPM without cognitive pauses or structural sentence revisions). Checkmark visualizes this transcription signature in the playback timeline.
3. What is the best way to handle group fieldwork where all lab partners share the same raw dataset?
In group fieldwork (e.g., a four-student APES stream sampling team), all group members are expected to share identical raw measurement tables. Checkmark’s student-to-student peer matching detects identical data tables within the same school repository without flagging the shared numbers as illicit plagiarism. However, each student's narrative analysis (their Claim-Evidence-Reasoning paragraphs, error evaluations, and discussion of ecological implications) must be composed independently. Checkmark tracks each student's independent writing process, ensuring that individual synthesis and interpretation are authentically demonstrated.
4. How can science teachers redesign lab rubrics to disincentivize students from faking clean data?
Science departments should shift the grading weight away from whether results “match the expected textbook value” and toward the quality of empirical sensemaking and error analysis:
- Allocate 30–40% of the rubric to Error Analysis & Anomaly Reconciliation: Award maximum points to students who clearly identify anomalies, calculate percentage error, explain instrument limitations, and propose rigorous methodological improvements.
- Explicitly State that Imperfect Data Receives Full Credit: Include clear syllabus language: “In this course, you are graded on your scientific reasoning, not on whether nature behaved cleanly. A report that explains why dissolved oxygen was lower than expected will receive a higher score than a fabricated report with perfect numbers.”
- Require Raw Field Artifacts: Mandate that students submit photos of their physical field data sheets or raw sensor log files alongside their formal reports.
5. How should a science teacher initiate a conference when Checkmark telemetry indicates fabricated lab data?
Adopt a supportive, non-punitive posture grounded in Checkmark’s philosophy: “Stop guessing, start trusting.”
- Invite the student to a private conference and open the Checkmark report together.
- Show the student the objective evidence: the playback timeline, calculation pause distribution, and clipboard paste capture.
- Frame the inquiry around scientific habits rather than moral condemnation: “I noticed that this data table and discussion were pasted into the document from an external source, and the numbers violate the physical saturation limits of dissolved oxygen. What happened during this lab session?”
- Address the underlying cause (e.g., panic over missed field data or fear of losing points for messy results) and provide a structured, restorative path to re-analyze authentic data for partial or full credit.
6. Does Checkmark store student lab reports to train commercial AI models?
No. Checkmark maintains a strict zero-data-retention policy for AI model training. Student lab reports, raw data submissions, and writing drafts are never ingested, cached, or utilized to train general or commercial LLMs. Checkmark is fully compliant with FERPA, COPPA, and state-level student privacy statutes.
7. How does Checkmark integrate with Canvas LMS, Buzz LMS, and Google Classroom?
Checkmark integrates seamlessly via native LTI 1.3 standards and API connectors. Once installed by a school or district administrator, teachers can enable Checkmark with a single checkbox within their standard LMS assignment creation interface. Students submit their lab reports directly through Canvas, Buzz, or Google Classroom. Checkmark automatically generates the writing process telemetry, paste inspection, and rubric autograding reports within the teacher's grading workflow, allowing one-click grade and feedback passback directly to the LMS gradebook.
10. Conclusion: Restoring Empirical Trust in Secondary Science Education
The challenge facing modern science educators is not simply catching students who use AI to generate lab reports. The deeper challenge is restoring student confidence in the value of authentic, messy, empirical scientific discovery.
When high school science teachers rely on black-box AI detectors or punitive, adversarial policies, they inadvertently create an environment of fear where honest students with unusual data are suspected and sophisticated cheats with polished synthetic reports are rewarded.
By implementing Checkmark Plagiarism’s multi-dimensional evidentiary suite—combining patent-pending Essay Playback™ writing telemetry, immutable clipboard payload forensics, passage-level confidence granularity, and quote-anchored rubric feedback—science departments can eliminate the guesswork, protect honest student effort, and transform integrity inquiries into powerful moments of scientific growth.
Ready to Bring Transparent Writing Telemetry & Empirical Integrity to Your Science Department?
Empower science faculty to verify authentic laboratory data analysis, eliminate false accusations, and accelerate CER rubric grading with direct Canvas and Buzz LMS synchronization.