
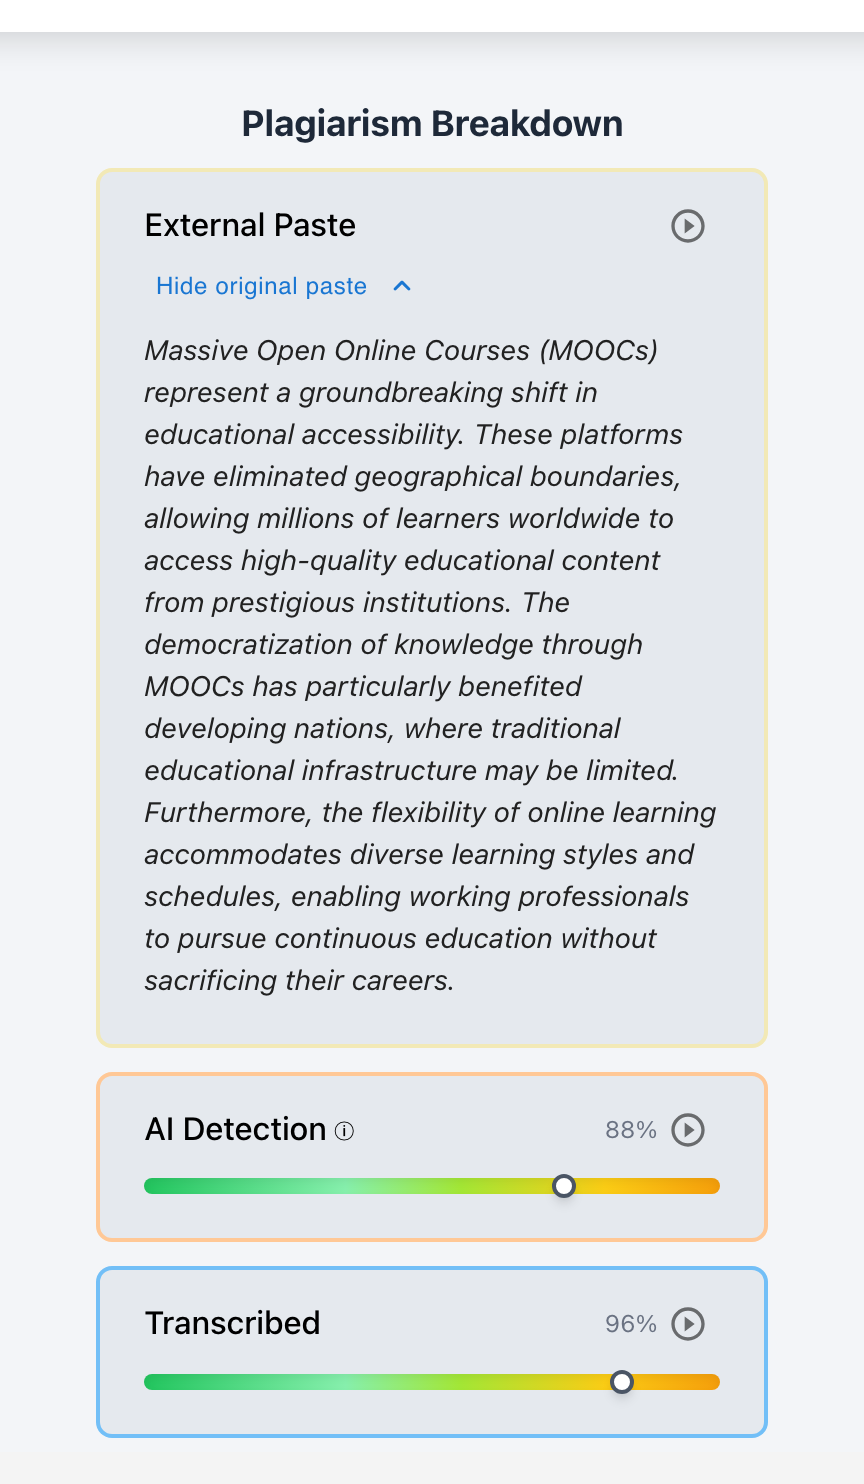
Advanced Placement Environmental Science (APES) educators, secondary science department chairs, and STEM curriculum coordinators face a rapidly escalating assessment crisis: generative AI-driven “digital dry-labbing”. Rather than conducting labor-intensive stream sampling, measuring soil horizon nutrient gradients, or executing multi-step spectrophotometric titrations across biogeochemical cycles, students are increasingly prompting Large Language Models (LLMs) to synthesize pristine, noise-free lab datasets and draft articulate Claim-Evidence-Reasoning (CER) narratives in seconds. Conventional plagiarism checkers miss these synthetic datasets entirely because generated numerical tables and novel prose share 0% text similarity with internet archives.
Simultaneously, generic black-box AI detectors fail catastrophically in science classrooms: they routinely flag authentic student writeups containing mandatory APES terminology (such as ammonification, denitrification, oligotrophic, biological oxygen demand, and pyrite oxidation stoichiometry) as “AI-generated,” while remaining completely blind to raw numerical fabrication. Checkmark Plagiarism resolves this assessment dilemma through a multi-dimensional, transparent evidentiary architecture: combining patent-pending Essay Playback™ (scrubbable 1x–8x keystroke-by-keystroke replay of data entry and cognitive calculation pauses), 100% immutable clipboard payload inspection (capturing external AI data drops before student rewrites), passage-level calibrated confidence sliders with honest <150-word short-text guardrails, and teacher-in-the-loop rubric autograding aligned with College Board AP Science Practices.
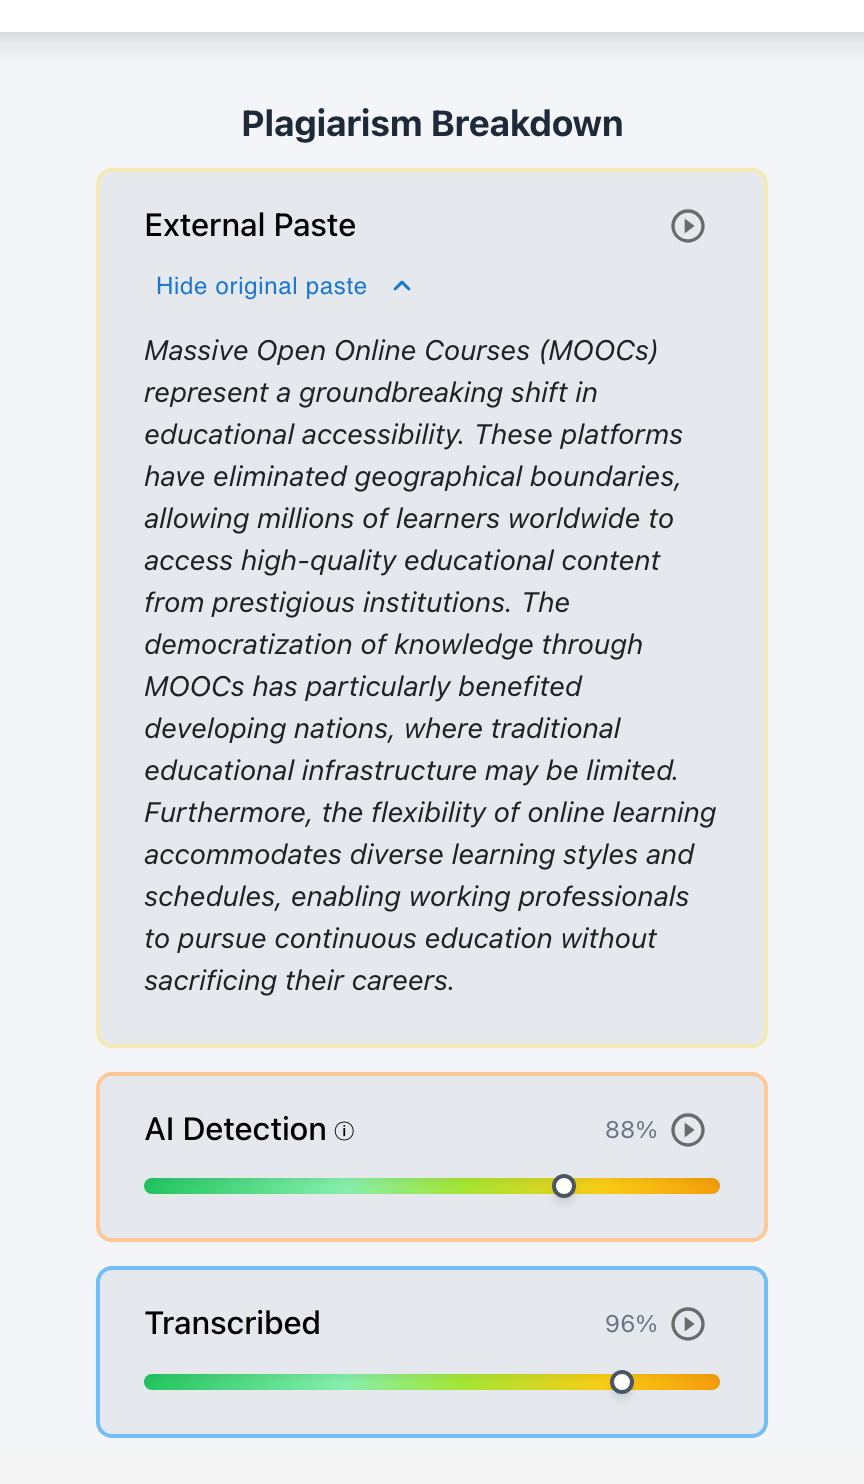
Checkmark Plagiarism empowers science educators and curriculum leaders with transparent writing verification, integrating directly with Canvas LMS, Agilix Buzz, and Google Classroom.
1. The Biogeochemical Inquiry Challenge in AP Environmental Science
In the College Board AP Environmental Science (APES) curriculum, laboratory investigations and empirical field inquiries are not supplementary enrichment activities; they are the empirical foundation of the course. Across Unit 1: The Living World: Ecosystems, Unit 4: Earth Systems and Resources, Unit 5: Land and Water Use, and Unit 8: Aquatic and Terrestrial Pollution, students are required to master the complex, non-linear mechanisms governing global biogeochemical cycling:
- The Nitrogen Cycle: Bacterial mineralization, ammonification, nitrification (
NH₄⁺ → NO₂⁻ → NO₃⁻), biological assimilation, and anoxic denitrification. - The Hydrologic and Aquatic Eutrophication Dynamic: Point and nonpoint nutrient loading, biological oxygen demand (
BOD₅), Streeter-Phelps dissolved oxygen sag curves, and hypolimnetic microbial decomposition regimes. - The Sedimentary Phosphorus Cycle: Mineral weathering, soil horizon sorption isotherms, pH-dependent phosphate binding (
Fe/Al/Camineral fixation), and agricultural runoff dynamics. - The Global Terrestrial Carbon Cycle: Photosynthetic drawdown, soil organic matter (SOM) microbial respiration fluxes, atmospheric equilibrium, and vegetative biomass allometry.
- The Sulfur Cycle & Acid Mine Drainage (AMD): Abiotic weathering vs. microbially catalyzed pyrite oxidation (
FeS₂), heavy metal mobilization, and aquatic acidification buffering plateaus.
- Field sampling in muddy streams and diverse soil horizons
- Probe sensor drift, thermal equilibration lag, and calibration noise
- Reagent meniscus parallax, cuvette turbidity, and titration drop variance
- Cognitive struggle to reconcile anomalous field data with textbook models
- Single prompt: “Generate APES nitrogen cycle lab data & 500-word CER”
- Zero measurement noise, rigid mathematical linearity (R² = 1.000)
- Textbook-perfect CER interpretation produced in 5 seconds
- Complete circumvention of empirical inquiry and physical data collection
Pristine, synthetic datasets appear superior to messy, genuine student field measurements. Generic AI detectors flag honest scientific vocabulary while remaining blind to raw numerical fabrication. Checkmark Plagiarism breaks this trap with scrubbable keystroke replay and immutable clipboard inspection.
The Pedagogical Value of Empirical Friction
The overarching goal of AP Environmental Science is articulated in the AP Science Practices (SP 1–7), which require students to explain environmental concepts, analyze visual representations, interpret experimental designs, analyze quantitative data, execute mathematical routines, and develop evidence-based environmental solutions.
When high school students step into the field or conduct bench-scale biogeochemical experiments, they encounter essential cognitive and physical friction:
- Sensor Hysteresis & Calibration Drift: Dissolved oxygen (DO) and pH probes do not stabilize instantly; they exhibit thermal equilibration lag (30–60 seconds), membrane fouling, and sensitivity to barometric fluctuations.
- Reagent & Human Volumetric Variance: Colorimetric assays (such as nitrate cadmium reduction or phosphate ascorbic acid-molybdate tests) and chemical titrations involve meniscus parallax uncertainty, subjective endpoint color transitions, and cuvette optical imperfections.
- Environmental Stochasticity & Spatial Heterogeneity: Soil core samples extracted five meters apart on a school campus exhibit significant natural variance in moisture, clay content, organic matter, and microbial activity.
- Cognitive Reconciliation: When experimental results diverge from the clean, idealized diagrams in AP textbooks, students must engage in authentic scientific inquiry—calculating percent error, identifying uncontrolled variables, accounting for biological assimilation, and defending their conclusions with messy empirical evidence.
The Rise of Generative “Digital Dry-Labbing”
Generative AI models (such as GPT-4o, Claude 3.5 Sonnet, and Gemini Pro) have transformed traditional dry-labbing from a crude act of copying a lab partner’s numbers into sophisticated, on-demand data synthesis.
A student who misses a field-sampling lab or neglects to record daily dissolved oxygen readings during a two-week pond mesocosm experiment can provide an LLM with a single prompt:
“Act as an AP Environmental Science student. Create a realistic 14-day data table showing cultural eutrophication in a 10-gallon freshwater aquarium after adding 5 grams of 10-10-10 fertilizer. Include Daily Water Temperature (°C), Dissolved Oxygen (mg/L), pH, Turbidity (NTU), and Nitrate Concentration (ppm). Then write a four-paragraph Claim-Evidence-Reasoning (CER) analysis explaining the microbial biochemical mechanisms causing the dissolved oxygen sag curve.”
Within seconds, the LLM produces a beautifully formatted Markdown table and an articulate scientific writeup. The generated data displays textbook progression: nitrates spike initially, algal blooms increase daytime DO and turbidity, subsequent algal senescence triggers bacterial decomposition, and dissolved oxygen crashes into hypoxia (<2.0 mg/L).
When an APES teacher grades this submission against a standard rubric, the synthetic report often receives an A because the data is spotless, the graphs display a perfect mathematical curve (R² ≈ 0.99), and the prose is grammatically flawless. Conversely, an honest lab group whose dissolved oxygen probe suffered calibration drift on Day 6—producing noisy readings that require thoughtful contextual explanation—risks receiving a B- for “inaccurate experimental results.”
This creates a profound equity and integrity crisis in secondary science education. To protect genuine scientific learning, educators must understand the exact physical, mathematical, and behavioral fingerprints that distinguish authentic student fieldwork from generative AI fabrication.
2. Deep Dive: Five Biogeochemical Cycle Labs & The Telltale Signatures of AI Data Fabrication vs. Authentic Empirical Analysis
Generative Large Language Models operate on probabilistic next-token prediction across vast text corpora. While LLMs excel at replicating qualitative descriptions of scientific principles, they consistently fail to model the messy thermodynamic, kinetic, and observational noise inherent in real-world environmental sampling.
Below is an exhaustive forensic analysis of the five most common APES biogeochemical laboratory investigations, contrasting genuine student data with generative AI fabrications.
24–48h bacterial colonization lag, distinct intermediate NO₂⁻ peak, spectrophotometer absorbance drift, non-linear mass recovery due to microbial biomass assimilation.
Instant linear conversion (NH₄⁺ → NO₃⁻), missing intermediate NO₂⁻ transition, flawless 100.0% molar conservation, absorbance values with impossible R² = 1.000 correlation.
Henry's Law solubility ceilings (max ~9.1 mg/L at 20°C), optical probe response lag (30–60s), diurnal photosynthetic spikes vs. nighttime respiration dips, BOD dilution noise.
Linear oxygen drops downstream, impossible supersaturation without active algae blooms (e.g. 14.5 mg/L at 25°C in darkness), instantaneous recovery without reaeration zones.
Non-linear Langmuir/Freundlich sorption isotherms, strong Fe/Al/Ca mineral fixation, high clay retention showing low soluble PO₄³⁻, variable extraction efficiencies.
Modeling phosphorus with atmospheric gas fluxes (violating sedimentary cycle laws), linear leaching rates identical to nitrate, uniform extraction regardless of soil pH buffering.
Exponential Q₁₀ temperature sensitivity, chamber seal boundary layer leakage drift, micro-quadrat spatial variance (30–50% between cores), soil moisture bell-curve inhibition.
Perfect linear CO₂ accumulation inside closed chambers for 60 mins, static respiration across temperature swings, identical replicate chamber measurements across diverse forest quadrats.
Multi-stage carbonate buffering plateaus before catastrophic pH collapse, microbial kinetic acceleration below pH 3.5 (A. ferrooxidans), Fe(OH)₃ yellow boy turbidity interference.
Linear arithmetic pH drops from 7.0 to 2.0 proportional to pyrite grams, reporting dissolved Fe³⁺ at neutral pH (chemically impossible), omission of abiotic vs. biotic reaction kinetics.
Lab 1: The Nitrogen Cycle & Agricultural Runoff Assays (Nitrification & Colorimetric Kinetics)
In this foundational APES lab (aligned with CED Topic 1.5: The Nitrogen Cycle and Topic 8.2: Human Impacts on Ecosystems), students set up simulated aquatic bioreactors or soil columns, add ammonium chloride (NH₄Cl) or urea, and track nitrogen species over 14–21 days using colorimetric test kits, spectrophotometers, or ion-selective electrodes.
Authentic Student Data & Analysis Characteristics:
- Microbial Colonization Lag Phase: For the first 48 to 96 hours, ammonium concentrations (
NH₄⁺) remain nearly flat (8.0 → 7.8 ppm) while nitrifying bacteria (Nitrosomonas) establish biofilm colonies on substrate media. - The Intermediate Nitrite (
NO₂⁻) Transition Curve: Between Days 5 and 10, nitrite concentrations climb sharply to a peak (e.g.,4.5 ppm) before declining as Nitrobacter populations surge to convert nitrite into nitrate (NO₃⁻). An authentic student graph displays three distinct, asynchronous curves. - Beer-Lambert Law Non-Linearity: When students use spectrophotometers (measuring absorbance at λ = 543 nm for nitrite or λ = 410 nm for cadmium-reduced nitrate), high concentrations (
>10 ppm) deviate from linearity (A = εbc) due to optical scattering, requiring dilution steps that introduce realistic calculation adjustments. - Mass Balance Discrepancies: Authentic student nitrogen recovery is rarely 100%. Total inorganic nitrogen (
NH₄⁺ + NO₂⁻ + NO₃⁻) typically declines by 15% to 30% due to bacterial assimilation into organic cellular biomass, ammonia volatilization at slightly alkaline pH, or localized micro-anoxic denitrification.
LLM Synthetic Fabrication Signatures:
- Instantaneous Linear Conversion: LLMs routinely generate datasets where
NH₄⁺immediately drops on Day 1 in a perfect straight line, whileNO₃⁻rises at an identical reciprocal rate (R² > 0.99). - The Missing Nitrite Peak: LLMs frequently omit the intermediate nitrite step entirely or show
NO₂⁻appearing and disappearing instantaneously within a single 24-hour interval without biological kinetic curve logic. - Impossible 100.0% Molar Conservation: The synthetic data maintains perfect mathematical molar balance down to two decimal places (
[N]total = 10.00 ppmat all times), demonstrating that the numbers were generated via an algebraic equation rather than biological metabolism. - Hallucinated Spectrophotometric Calibration: When asked for raw absorbance values, LLMs generate pristine calibration points (e.g.,
0.000, 0.100, 0.200, 0.300, 0.400) with zero baseline dark-current drift or cuvette mismatch.
Lab 2: Aquatic Eutrophication & Dissolved Oxygen (DO) Sag Curves (BOD & Temperature Dynamics)
Investigating cultural eutrophication and biological oxygen demand (CED Topic 8.1: Sources of Pollution and Topic 8.7: Eutrophication) requires students to sample a freshwater body downstream from a point source or simulate nutrient loading in classroom carboys.
  DO (mg/L)
   10 ┌─────────────────────────────────────────────────────────── Clean Water (>8.0 mg/L)
      │                                                       /
    8 │   Decomposition Zone                                 /  Recovery Zone
      │    (High BOD₅ Microbial Respiration)                /
    6 │                                                    /
      │       Septic Zone (Hypoxia: <2.0 mg/L)            /
    4 │     _____________________________________________/
    2 │
    0 └───────────────────────────────────────────────────────────
      Point Source          Distance / Time Downstream ───────>
Authentic Student Data & Analysis Characteristics:
- Henry's Law Solubility Constraints: Authentic student writeups reflect real thermodynamic limits. At 22°C, fresh water has a maximum dissolved oxygen saturation limit of approximately
8.7 mg/Lat 1 atm. Even in healthy water, cold morning temperatures yield higher baseline DO than warm afternoon samples. - Probe Equilibration Friction: Dissolved oxygen probes (such as Clark polarographic or luminescence-based optical sensors) exhibit a 30- to 60-second response stabilization period. Student lab notes frequently show scribbled initial readings crossed out as the probe settled.
- Diurnal Photosynthetic Inversions: In outdoor or illuminated mesocosms, authentic data captures diurnal swings: daytime dissolved oxygen spikes due to macrophyte and phytoplankton photosynthesis, followed by steep pre-dawn drops as cellular respiration consumes oxygen without photosynthetic replenishment.
BOD₅Dilution Bottle Uncertainty: Five-day biochemical oxygen demand tests require volumetric dilutions. Real student reports reflect titration drop errors (±0.2 mg/L) and blank bottle respiration corrections.
LLM Synthetic Fabrication Signatures:
- Linearized Dissolved Oxygen Drops: Synthetic datasets model oxygen decline as a straight linear slope (
y = -mx + b) rather than an asymmetrical exponential curve driven by competing deoxygenation and reaeration constants (k₁andk₂). - Thermodynamically Impossible Supersaturation: LLMs frequently hallucinate baseline DO values like
14.5 mg/Lin 24°C water without any documented hyper-eutrophic microalgae bloom or cold-water aeration, violating fundamental gas solubility laws. - Instantaneous Recovery Without Reaeration Distance: In spatial stream models, LLMs often drop DO to
0.5 mg/Lat Station 3 and restore it to9.0 mg/Lat Station 4 (only 20 meters downstream), ignoring the physical hydraulic mixing and atmospheric diffusion time required for reaeration.
Lab 3: Soil Phosphorus Horizons & Sorption Kinetics (Sedimentary Cycling & Agricultural Leaching)
In soil chemistry investigations (CED Topic 4.2: Soil Formation and Erosion and Topic 5.7: Meat Production Methods & Agricultural Runoff), students analyze orthophosphate (PO₄³⁻) sorption capacity across different soil textures (sand, silt, clay) and horizons (O, A, B, C).
High Fe³+ & Al³+ Fixation. Formation of insoluble FePO₄ & AlPO₄ precipitates. Strong sorption to clay mineral lattices.
Maximum Plant-Available H₂PO₄⁻ & HPO₄²⁻ in solution. Moderate sorption capacity with bioavailable exchange equilibrium.
High Ca²+ Fixation. Precipitation into insoluble tricalcium phosphate Ca₃(PO₄)₂. Low leaching mobility in leachate.
Authentic Student Data & Analysis Characteristics:
- Non-Linear Adsorption Isotherms: When students shake soil samples with varying concentrations of standard phosphate solution (
0, 5, 10, 25, 50 ppm), phosphorus binding follows non-linear Langmuir or Freundlich adsorption curves—saturating available mineral exchange sites at higher concentrations. - Severe Texture Disparities: Sandy soils allow rapid phosphate leaching (
>80%recovery in leachate), whereas clay-rich B horizons adsorb over95%of added phosphate due to iron and aluminum oxide coatings, yielding near-zero soluble phosphorus in initial washings. - Turbidity and Colorimetric Interferences: Colorimetric ascorbic acid-molybdate assays require filtration. Authentic student samples often have slight colloidal turbidity that produces elevated baseline absorbance blanks, requiring careful subtraction.
LLM Synthetic Fabrication Signatures:
- Atmospheric Reservoir Hallucinations: LLM CER writeups frequently make conceptual errors, referring to “atmospheric phosphorus gas deposition” or “phosphorus vapor condensation”—violating the fundamental APES principle that the phosphorus cycle lacks a significant atmospheric component.
- Uniform Linear Leaching: Synthetic data treats phosphorus like highly soluble nitrate, showing equal leaching percentages across sand, loam, and clay horizons without accounting for mineral sorption kinetics.
- Ignoring pH-Dependent Fixation: When prompted to analyze phosphorus availability across a soil pH gradient (
4.0 to 9.0), LLMs often generate linear availability curves, failing to model the dual fixation zones (insoluble iron/aluminum phosphates in acidic soils and insoluble calcium phosphates in alkaline soils).
Lab 4: Terrestrial Carbon Sequestration & Soil Respiration Flux
In carbon flux investigations (CED Topic 1.4: The Carbon Cycle and Topic 9.3: Greenhouse Effect), students measure soil microbial CO₂ efflux using dynamic closed chambers connected to digital infrared gas analyzers (IRGA, Vernier/PASCO CO₂ probes) or alkaline barium hydroxide (Ba(OH)₂) trapping titrations.
  CO₂ (ppm)
   1200 ┌──────────────────────────────────────────────────────── Asymptotic Ceiling
        │                                                     ... (Diffusion gradient weakens)
   1000 │                                              . . '
        │                                      . . '
    800 │                              . . '
        │                      . . '
    600 │              . . '
        │      . . '   (Initial Linear Slope = True Soil Flux)
    400 └──────┴───────┴───────┴───────┴───────┴───────┴───────┴───────
        0      5      10      15      20      25      30      Time (min)
Authentic Student Data & Analysis Characteristics:
- Asymptotic Chamber Accumulation: In a closed soil chamber,
CO₂concentration rises linearly only for the first 3 to 5 minutes. As internalCO₂increases, the diffusion gradient between the soil pore space and chamber headspace narrows, and micro-leaks in chamber foam gaskets cause the rate of accumulation to level off asymptotically. Q₁₀Temperature Sensitivity: Authentic student datasets comparing warm forest soils (25°C) to refrigerated soil cores (5°C) reflect an exponential temperature coefficient (Q₁₀ ≈ 2.0 to 2.5), showing a doubling of respiration rate per 10°C rise.- Spatial Heterogeneity & Root Biomass: Replicate soil cores extracted 2 meters apart exhibit 30% to 60% variance in
CO₂efflux depending on whether the core captured active tree root clusters or inert subsoil.
LLM Synthetic Fabrication Signatures:
- Unbroken Linear Flux Across 60 Minutes: Synthetic data displays a rigid linear increase (
R² = 1.0000) inside closed chambers for extended durations, completely ignoring diffusion boundary layer resistance and physical chamber seal leakage. - Zero Spatial Replicate Variance: LLMs generate replicate forest soil samples with identical respiration rates (e.g.,
4.12, 4.15, 4.10, 4.14 μmol CO₂ m⁻²s⁻¹), an impossibility in real forest ecosystems where root density and fungal mycorrhizae vary wildly. - Linear Temperature Extrapolations: LLMs often project soil respiration to increase linearly up to 65°C, failing to account for thermal denaturation of soil microbial enzymes above 45°C.
Lab 5: Acid Mine Drainage (AMD) & Sulfur Oxidation Stoichiometry
Investigating sulfur biogeochemistry and mining impacts (CED Topic 5.9: Mining Impacts and Topic 8.5: Mining and Acid Drainage) involves oxidizing iron pyrite (FeS₂) in batch reactors to measure pH decline, electrical conductivity spikes, and ferric hydroxide precipitation.
Authentic Student Data & Analysis Characteristics:
- The Carbonate Neutralization Plateau: If the ore or stream water contains trace limestone (
CaCO₃), the initial pH remains buffered near6.5 to 7.5for days. Only after carbonate buffering capacity is exhausted does the solution suffer a rapid drop topH 2.5. - Biotic Kinetic Acceleration Below pH 3.5: Below pH 3.5, acidophilic iron-oxidizing bacteria (Acidithiobacillus ferrooxidans) catalyze the oxidation of ferrous iron (
Fe²+) to ferric iron (Fe³+) at rates over 100,000 times faster than abiotic oxygenation, causing an exponential surge in acidity. - Colloidal “Yellow Boy” Turbidity Interference: Precipitation of amorphous ferric hydroxide (
Fe(OH)₃) creates a thick orange/yellow precipitate that severely interferes with optical pH meters and colorimeters, requiring centrifugation or filtration that students must document in their methodology.
LLM Synthetic Fabrication Signatures:
- Linear pH Drops: LLMs generate pH tables that drop in even arithmetic increments (e.g.,
7.0 → 6.0 → 5.0 → 4.0 → 3.0 → 2.0), demonstrating a total misunderstanding of logarithmic hydrogen ion scaling (pH = -log[H⁺]). - Chemical Coexistence Hallucinations: Synthetic reports frequently list high concentrations of dissolved ferric iron (
Fe³+ > 50 ppm) alongside neutral pH values (pH 7.2), an impossible chemical state because ferric iron immediately hydrolyzes and precipitates as solid hydroxide at pH > 3.5. - Instantaneous Pyrite Weathering: LLMs model abiotic pyrite dissolution as completing in 15 minutes, failing to account for the days-long induction kinetics of sulfide mineral oxidation.
3. The Pedagogical Dilemma: Why Conventional Integrity Tools Fail in APES Labs
When secondary science teachers suspect that an APES lab report contains fabricated data or AI-generated reasoning, they typically turn to either traditional plagiarism checkers (Turnitin, CopyLeaks, Unicheck) or standalone, generic AI text detectors (GPTZero, ZeroGPT, Turnitin AI Writing Indicator).
In high school science departments, both approaches fail fundamentally.
APES lab reports require domain-specific terminology (ammonification, denitrification, oligotrophic, hypolimnion, pyrite stoichiometry). Generic AI detectors calculate token perplexity; high-entropy scientific terms heavily match textbook training corpora → Triggers 75%–95% false AI scores on honest, high-achieving students.
AP scoring rubrics mandate rigid Claim-Evidence-Reasoning structures (“Claim: ... Evidence: ... Reasoning: ...”). Generic detectors treat structural formulaicism as automated AI generation, punishing students for adhering strictly to teacher guidelines.
Plagiarism checkers search for exact string matches; fabricated numbers have 0% similarity. Generic AI detectors only evaluate NLP prose tokens; they cannot audit spreadsheets, verify sensor logs, or calculate stoichiometric mass balances.
Accusing an AP student based on an opaque “82% AI Probability” score leads to defensive pushback, parental outrage, and administrative grievances without defensible evidence or pedagogical recourse.
The Specialized Lexicon Penalty (False Positive Trap)
Generic AI detectors determine whether text is machine-generated by measuring two statistical metrics: perplexity (the predictability of words in a sequence) and burstiness (the variation in sentence structure and length).
In an Advanced Placement science course, students are explicitly instructed to write in an objective, concise, passive-voice academic register. Furthermore, AP scoring rubrics demand the precise deployment of specialized biogeochemical terminology:
- “Biological oxygen demand increased exponentially in the hypolimnion due to microbial decomposition of senescent phytoplankton.”
- “Chemoautotrophic Nitrosomonas oxidized aqueous ammonium into nitrite, which was subsequently oxidized into nitrate by Nitrobacter.”
- “Pyrite oxidation catalyzed by Acidithiobacillus ferrooxidans generated hydronium ions and sulfuric acid, depressing effluent pH to 2.3.”
Because these scientific terms appear with high regularity in textbooks, Wikipedia articles, and open-access scientific publications across the web, Large Language Models predict these exact word pairings with near-zero perplexity. Consequently, when an honest APES student submits a meticulously researched, technically rigorous lab report, generic AI detectors routinely flag the writeup as 75% to 95% AI-generated.
This creates a devastating educational crisis: the harder a student works to adopt precise scientific vocabulary, the more likely they are to be falsely accused of academic dishonesty.
The Blind Spot for Fabricated Data Tables
Conversely, when a student prompts an LLM to invent a completely fabricated table of dissolved oxygen readings or soil phosphorus concentrations, the numbers have never existed anywhere on the internet.
Traditional plagiarism checkers evaluate the submission and report 0% Similarity, giving the teacher a false sense of security. Standalone AI detectors strip out numerical tables and evaluate only the accompanying text—often missing synthetic data that has been slightly reworded or paraphrased by the student.
Science educators are left trapped between two unacceptable outcomes: falsely accusing honest students based on black-box percentage scores, or giving top grades to completely synthetic lab reports that bypassed all empirical learning.
4. The APES Evidentiary Matrix: Comparing Integrity Approaches
To evaluate student lab work defensibly, science educators need multi-dimensional, transparent evidence that captures both the empirical data provenance and the cognitive writing process.
| Evidentiary Dimension | 1. Physical Lab Notebooks | 2. Generic AI Detectors | 3. Google Docs History | 4. Checkmark & Essay Playback™ |
|---|---|---|---|---|
| Field Data Provenance | High for raw field notes; vulnerable to post-hoc transcription edits. | None. Detectors do not parse numerical datasets or probe logs. | Low. Only captures coarse text snapshots every 10–30 minutes. | Absolute. Timestamped capture of raw digital sensor imports vs. external text pastes. |
| Keystroke-Level Timeline Replay | None. Static paper artifacts offer zero temporal drafting data. | None. Delivers only an opaque, whole-document percentage score. | None. Lacks micro-keystroke replay; collapses typing into batch revisions. | Patent-Pending Essay Playback™. Scrubbable 1x–8x replay of every keystroke and edit. |
| External Clipboard Payload Capture | None. Cannot track clipboard interactions. | None. No visibility into copy-paste mechanics. | Partial. Flags large text insertions but does not store original raw payload. | 100% Immutable Clipboard Inspector. Preserves exact external text even if rephrased. |
| Data-Thinking Pause Telemetry | None. Cannot measure cognitive processing time. | None. Oblivious to typing cadence or pausing patterns. | None. Time intervals are too coarse to identify cognitive pauses. | Full Telemetry. Identifies 15–90s data-thinking pauses during stoichiometric calculations. |
| Passage-Level AI Granularity | Not Applicable. | None. Assigns a single whole-paper score that confuses procedural text with reasoning. | Not Applicable. | Passage-Level Confidence Sliders. Evaluates individual CER claims with calibrated sliders. |
| Short-Text Guardrails (<150 Words) | Not Applicable. | Fails. Generates high false positives on short hypothesis and data captions. | Not Applicable. | Guaranteed N/A. Displays honest N/A for text under 150 words to prevent false flags. |
| AP Science Practice Rubric Scoring | High manual teacher grading burden; inconsistent across sections. | None. No alignment with College Board Science Practices (SP 1–7). | None. No pedagogical evaluation tooling. | Teacher-in-the-Loop Autograder. Quote-anchored justifications aligned with AP rubrics. |
| Restorative Conference Defensibility | Subjective teacher-student debates over handwriting or memory. | Adversarial. Black-box score triggers student denial and parent escalation. | Ambiguous. Coarse revision blocks look like bulk pasting even for honest typists. | Collaborative. Objective video replay allows student to explain their data reasoning. |
5. Step-by-Step Science Teacher Lab Audit Protocol
To transition from guesswork and adversarial accusations to supportive, evidence-based academic integrity, AP Environmental Science teachers, department chairs, and STEM coordinators should implement the following 4-Phase Lab Audit Protocol.
- Cross-reference station notes
- Check probe resolution/decimals
- Validate ambient field weather
- Henry's Law DO saturation limits
- Logarithmic pH vs. ion balance
- Flag R² = 1.000 “clean trap”
- Scrub keystrokes at 2x–4x
- Audit 15–90s calculation pauses
- Inspect clipboard text payloads
- Inquiry-based video walkthrough
- Student explains calculations
- Provide hands-on re-trial path
Phase 1: The Empirical Concordance Audit
Before evaluating the prose quality of an APES lab report, verify the physical provenance of the raw data:
- Station Data Cross-Referencing: Compare the numbers in the student's submitted digital table with the raw physical data sheet recorded at their laboratory bench or field station. If four lab partners conducted an experiment together, their raw baseline measurements should match within minor recording variations, while their qualitative analyses should remain independent.
- Sensor Precision & Device Fingerprinting: If students used digital dataloggers (Vernier LabQuest, PASCO Spark, or Google Science Journal), check that decimal precision matches the physical resolution of the hardware (e.g., optical DO sensors record to
0.01 mg/L; basic colorimeters record absorbance to0.001 AU). A student submitting data with six decimal places (0.045892 ppm) has almost certainly used an algebraic simulation or LLM generator. - Ambient Field Validation: Cross-check reported ambient parameters (such as air temperature, barometric pressure, stream flow rate, or water temperature) against documented historical conditions for the date and time of the field trip.
Phase 2: Stoichiometric & Thermodynamic Boundary Spot-Checks
Execute rapid mathematical spot-checks against known physical constants and biogeochemical principles:
- Henry's Law Saturation Ceilings: Calculate the maximum theoretical dissolved oxygen concentration for the reported water temperature and elevation. If a student reports a DO of
12.8 mg/Lin a warm pond sample (24°C) without demonstrating massive phytoplankton supersaturation, the data is physically impossible. - Logarithmic pH vs. Ion Concentration Check: Ensure that reported pH shifts correspond logically to hydrogen ion production. A drop from pH 7.0 to pH 3.0 represents a 10,000-fold increase in
[H⁺]concentration. In an acid mine drainage lab, verify whether the mass of pyrite added could stoichiometrically generate that quantity of hydronium ions. - The “Impossible Perfection” Flag (
R² ≈ 1.000): In high school environmental science, authentic field scatterplots rarely achieve a coefficient of determination exceedingR² = 0.96. If a student's linear regression of soil respiration rate vs. temperature yields anR² = 0.9998across messy field quadrats, treat the dataset as high-probability synthetic fabrication.
Phase 3: Writing Process Forensics with Essay Playback™
Open the student's submission in Checkmark Plagiarism and launch Patent-Pending Essay Playback™ to inspect the temporal writing history:
| Timestamp | Author Action | Characters Added | Writing Velocity & Cadence |
|---|---|---|---|
| 00:00:00 | [Session Start] Student types Title and Introduction organically | +280 chars | 35–45 WPM (Human baseline) |
| 00:14:23 | [EXTERNAL PASTE DETECTED] 14-day data table dropped from external LLM | +842 chars in 0.2s | Instant Clipboard Drop |
| 00:14:25 | [48-Second Cognitive Pause] Student consults graphs and performs molarity calculations | 0 chars (Idle) | Data-Thinking Interval |
| 00:15:13 | [Organic CER Drafting] Student drafts Claim, backspaces “nitrification” to “denitrification” | +620 chars | 28 WPM (Organic revision) |
What Authentic Scientific Drafting Telemetry Looks Like:
- The “Data-Thinking” Pause Rhythm: As students write their CER analysis, they do not type continuously. Authentic scientific writing exhibits frequent 15- to 90-second pauses where the cursor remains idle while the student looks at their spreadsheet, consults a graph, checks a unit conversion on a calculator, or re-reads their lab handout.
- Organic Vocabulary Corrections: Students frequently type a specialized term, pause, delete it, and replace it with a more precise concept (e.g., typing “decomposition”, backspacing 13 characters, and replacing it with “microbial cellular respiration”).
- Non-Linear Revision Loops: Authentic writers jump between their Evidence and Reasoning sections, refining their numerical citations to align with their explanatory arguments.
What Generative AI Shortcuts Look Like:
- The Instant External Payload Dump: The entire data table or CER analysis appears in a single 0.2-second event (
+1,200 characters). Checkmark's Immutable Clipboard Inspector reveals the raw external text payload—allowing the teacher to confirm whether the pasted text originated from a school-approved spreadsheet or an LLM chatbot. - Mechanical Second-Screen Transcription: If a student retypes text while looking at an LLM response on their phone or second monitor, Essay Playback™ reveals a robotic, steady typing velocity (60–80 WPM) with zero backspaces, zero conceptual pauses, and uniform keypress intervals across multi-sentence paragraphs.
Phase 4: Restorative Scientific Integrity Debriefs
When writing telemetry indicates that a student relied on AI-generated data or synthetic interpretations, avoid punitive confrontations. Instead, schedule a supportive, 10-minute restorative conference anchored by the scrubbable Essay Playback™ timeline.
Teacher: “Let’s review your APES lab writeup together. I love how clearly your reasoning connects the nitrogen cycle to the eutrophication curve. Let’s look at your drafting timeline in Checkmark to see how your thinking developed.”
Teacher plays back the session at 4x speed, stopping at the 0.2s external paste event. “I noticed that your complete 14-day dissolved oxygen dataset and CER analysis were inserted at 11:42 PM in a single paste. Walk me through how your lab group collected these measurements and calculated the biological oxygen demand between Station 2 and Station 3.”
When the student acknowledges using generative AI: “In AP Environmental Science, the learning happens when we wrestle with messy, imperfect data. Here is our restorative pathway: you can join the after-school lab session to run a calibrated bench titration, record real data, and draft an authentic CER analysis for full mastery credit.”
6. How Checkmark Plagiarism Empowers AP Environmental Science Educators
Checkmark Plagiarism delivers an integrated edtech platform engineered specifically for secondary and collegiate science educators, STEM curriculum leaders, and academic integrity committees.
Keystroke replay at 1x to 8x speed. Visualizes data-thinking pauses and distinguishes organic human formula derivations from external clipboard dumps.
Preserves 100% of external clipboard text payloads, timestamped and linked directly to the exact millisecond in the replay timeline.
Calibrated confidence sliders evaluate individual CER claims. Honest N/A guardrail protects hypotheses, procedures, and data labels under 150 words from false flags.
Aligned with AP Science Practices 1–7. Provides quote-anchored rubric justifications with complete teacher final editing and grading authority.
1. Patent-Pending Essay Playback™ (1x–8x Replay)
Science educators can scrub through a student's complete writing and calculation session keystroke by keystroke. Teachers can observe the exact moment data points were entered, watch how formulas were drafted and revised, and verify authentic cognitive struggle during complex stoichiometric derivations.
2. 100% Immutable Clipboard Payload Inspection
When students import data from external spreadsheets, sensor software (Vernier Logger Pro, Graphical Analysis), or outside websites, Checkmark captures and stores the exact external text payload. Even if a student rewrites or paraphrases every single word of a pasted AI response, Checkmark's sidebar preserves the original clipboard content, complete with a direct “Jump to Playback” button.
3. Passage-Level Calibrated AI Sliders with <150-Word Guardrails
Rather than labeling an entire 2,000-word laboratory report with a single deceptive percentage, Checkmark underlines specific sentences and paragraphs with individual Evidence Cards in the sidebar. Each card features a calibrated confidence slider (Typical Human Writing Style vs. Typical AI Pattern). For short procedural text, hypotheses, or data table labels under 150 words, Checkmark automatically displays N/A, protecting students from false positive flags on standard scientific formatting.
4. Teacher-in-the-Loop Quote-Anchored Rubric Autograding
Checkmark's Autograder accelerates grading workflows while preserving teacher authority. Educators can upload custom AP Environmental Science rubrics or sync directly with Canvas LMS, Agilix Buzz, or Google Classroom. The autograder generates:
- Per-Criterion Point Allocations: Evaluated against AP Science Practice 5 (Data Analysis), Practice 6 (Mathematical Routines), and Practice 7 (Environmental Solutions).
- Quote-Anchored Justifications: Every rubric score is linked directly to specific student prose and numerical calculations.
- Teacher Final Authority: All AI evaluations remain provisional drafts until reviewed, edited, and approved by the teacher before gradebook passback.
5. Enterprise FERPA & COPPA Compliance with Zero Model Training
Under Checkmark's strict enterprise privacy agreements, student laboratory data, experimental writeups, and personal information are never retained to train public or commercial AI models. All data is encrypted in transit and at rest, fully compliant with federal student privacy standards.
7. Frequently Asked Questions (FAQ)
1. How can APES teachers distinguish between a student pasting authentic sensor data versus an AI-generated data table?
When a student pastes authentic data exported from a digital datalogger (such as Vernier Graphical Analysis, PASCO Capstone, or a Google Sheet), Checkmark's External Clipboard Inspector captures the raw payload. Genuine sensor data exhibits characteristic tab-delimited formatting, raw sensor timestamps (e.g., 10 Hz or 1 Hz intervals), sensor calibration headers, realistic decimal noise, and documented thermal equilibrium drift. In contrast, an AI-generated data table pasted from an LLM chatbot typically arrives in Markdown pipe format (| Station | DO (mg/L) |), displays uniform integer steps or round decimals, and lacks hardware device headers. Furthermore, with Essay Playback™, teachers can observe whether the student spent time cleaning, formatting, and analyzing the imported dataset or immediately generated a polished CER interpretation with zero analytical lag.
2. Why do generic AI detectors assign high AI probability scores to honest students writing scientific lab reports?
Generic AI detectors calculate the statistical predictability (perplexity) and structural variation (burstiness) of words. In Advanced Placement science courses, students are required to write in a concise, objective, passive-voice register and use precise, standardized scientific vocabulary (such as ammonification, chemosynthesis, oligotrophic, denitrification, and biological oxygen demand). Because these exact terms and Claim-Evidence-Reasoning (CER) sentence frames appear with high frequency in scientific training data, LLM classifiers evaluate them as “highly predictable” and assign elevated AI probability scores. Checkmark eliminates this flaw by using passage-level calibrated confidence sliders that evaluate conceptual synthesis rather than vocabulary density, backed by Essay Playback™ telemetry that proves authentic human drafting.
3. What should a teacher do if a student's lab data looks suspiciously perfect (R² ≈ 1.0) but no plagiarism matches are found?
When experimental data appears suspiciously clean without web matches, follow the 4-Phase Lab Audit Protocol:
- Check the raw station data sheet from the student's physical lab group.
- Spot-check physical boundary conditions (such as Henry's Law dissolved oxygen saturation limits at the reported water temperature).
- Review the student's Essay Playback™ session in Checkmark. Check whether the numerical table was constructed point-by-point with authentic calculation pauses or dropped in as a single external paste.
- If writing telemetry reveals an external paste from an AI tool, schedule a supportive restorative conference using the playback timeline to guide the student through a hands-on laboratory re-trial.
4. How does Essay Playback™ accommodate students with IEPs, 504 plans, or approved speech-to-text dictation tools?
Checkmark is built to protect all learners, including neurodivergent students and those with physical accommodations. Approved speech-to-text dictation software inputs text in natural phrase bursts accompanied by brief pauses as the student speaks and the software transcribes. Essay Playback™ visualizes these distinct acoustic-cadence bursts, clearly differentiating legitimate assistive technology from instant multi-paragraph external AI clipboard pastes. Furthermore, teachers can annotate student profiles with approved accommodation flags to ensure fair, transparent evaluations.
5. Can Checkmark's Rubric Autograder evaluate mathematical routines required by AP Science Practice 6?
Yes. Checkmark's Autograder supports custom, multi-trait science rubrics. When configured for AP Science Practice 6 (Mathematical Routines), the autograder evaluates whether students correctly set up dimensional analysis equations, propagated metric units (e.g., mg/L to kg/day), maintained appropriate significant figures, and accurately calculated environmental rates of change (such as BOD deoxygenation rates or percentage recovery). Every score is accompanied by a quote-anchored justification linking the grade directly to the student's written calculations.
6. Does Checkmark store student lab reports in public AI databases?
No. Under Checkmark's strict privacy policy, student submissions are never added to public training corpora or used to train commercial Large Language Models. Checkmark is fully compliant with FERPA, COPPA, and state-level student data privacy mandates. All document processing occurs within secure, encrypted cloud infrastructure with zero permanent third-party retention.
7. How should high school science departments update their laboratory syllabus policies regarding generative AI?
Science departments should establish clear, transparent boundaries that distinguish between authorized cognitive assistance and prohibited empirical fraud:
- Authorized AI Uses: Brainstorming experimental design variations, finding supplementary peer-reviewed research papers, debugging Python or spreadsheet data-analysis formulas, and reviewing grammatical clarity in draft revisions.
- Prohibited AI Uses: Prompting LLMs to synthesize simulated lab data (“digital dry-labbing”), generating fabricated raw observations, or pasting unedited AI-generated Claim-Evidence-Reasoning paragraphs.
- Evidentiary Transparency: Department policies should explicitly state that laboratory grades are evaluated based on both the final submission and the authentic writing process telemetry recorded via Checkmark.
8. Summary: Stop Guessing, Start Trusting in Science Education
The integrity of science education depends on authentic empirical inquiry. When students bypass the physical and cognitive friction of environmental fieldwork by generating synthetic data and AI interpretations, they lose the opportunity to develop true scientific literacy, quantitative reasoning, and ecological problem-solving skills.
Generic black-box AI detectors cannot solve this crisis—they alienate honest students with false accusations while failing to catch synthetic datasets.
By implementing Checkmark Plagiarism, science educators gain the transparent, defensible tools they need:
- Patent-Pending Essay Playback™ to verify authentic drafting and data-thinking rhythms.
- Immutable Clipboard Inspection to catch external synthetic data drops.
- Passage-Level Sliders with Short-Text Guardrails to protect students using rigorous scientific vocabulary.
- Teacher-in-the-Loop Rubric Autograding to provide meaningful, quote-anchored feedback aligned with AP Science Practices.
Stop Guessing, Start Trusting in Science Education
Transform your science department's laboratory assessment workflow with transparent writing process telemetry, immutable clipboard inspection, and quote-anchored rubric autograding.