
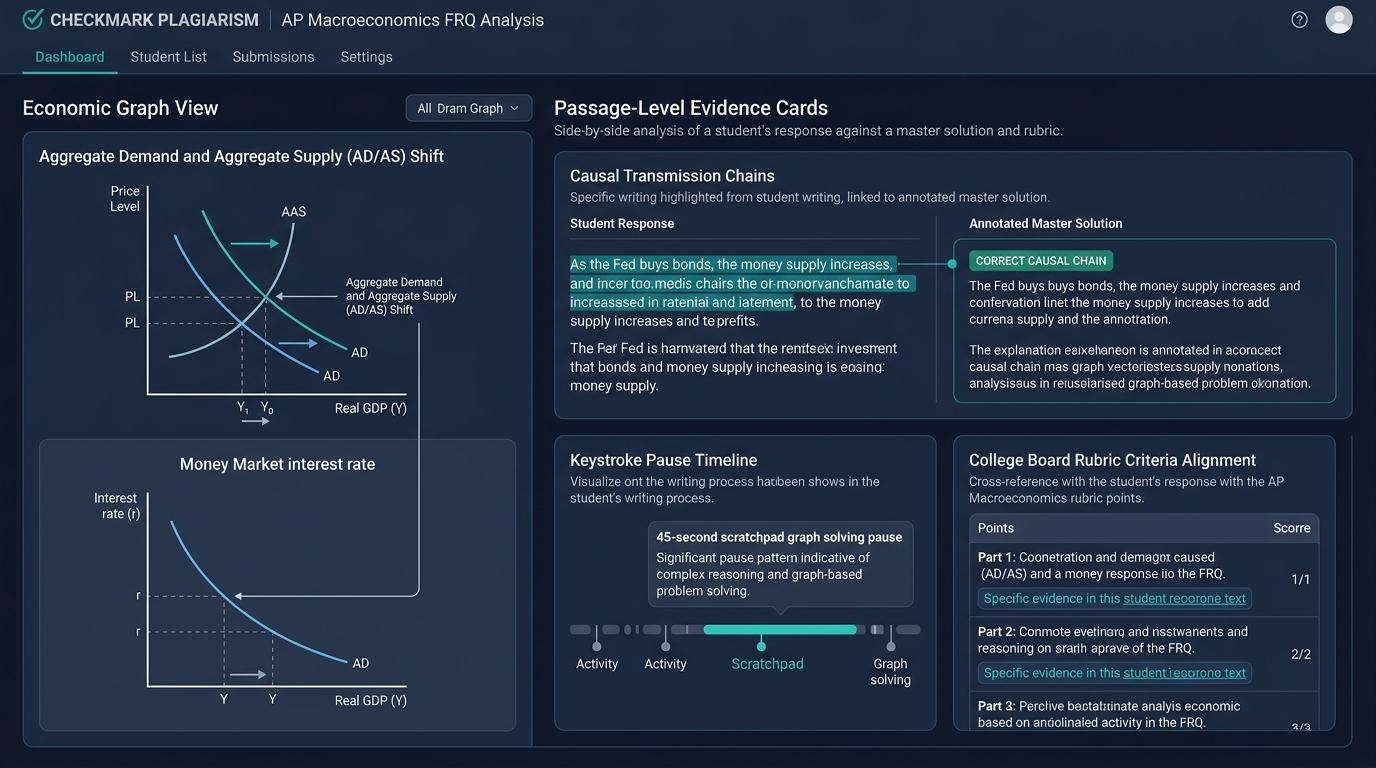
Executive Summary & Disciplinary Mandate
In Advanced Placement (AP) Macroeconomics and Microeconomics, authentic student mastery is defined not merely by vocabulary, but by rigorous graph-to-prose concordance and unbreakable chains of causation. When answering Free Response Questions (FRQs) or analytical policy prompts, students must coordinate multidimensional graphical shifts (Aggregate Demand/Aggregate Supply, Phillips Curves, Money Market/Loanable Funds, and Foreign Exchange markets) with precise, sequential explanatory prose. However, the rise of large language models (LLMs) presents a unique disciplinary crisis: AI tools effortlessly generate sophisticated macroeconomic jargon that appears superficially brilliant but routinely conceals fatal analytical flaws—including inverted shift directions, axis contradictions, conflated short-run versus long-run adjustments, and hallucinated transmission steps.
Generic whole-paper AI detectors fail catastrophically in economics education due to the Low-Perplexity Paradox: because authentic economic analysis relies on standardized definitions, formulaic College Board phrasing, and disciplined causal templates, legacy statistical detectors routinely generate false positives against honest students while remaining blind to hallucinated shift logic. Checkmark Plagiarism resolves this challenge through a multidimensional evidentiary approach: combining step-by-step causal chain auditing, passage-level linguistic analysis, and patent-pending Essay Playback™ to observe the organic pauses, revisions, and cognitive scratchpad referencing inherent in genuine economic graph-shifting analysis.
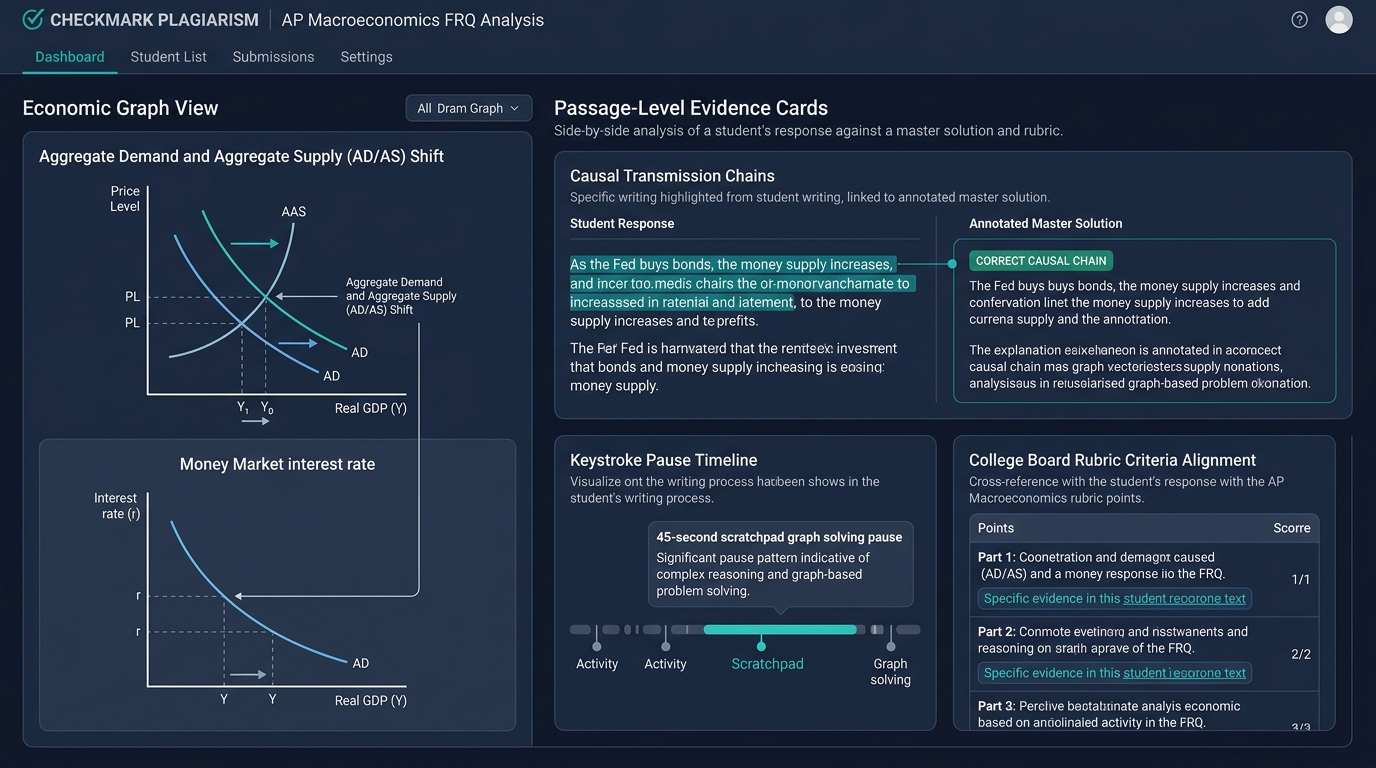
Layer 1: Graph-to-Prose Concordance
- Axis notation & equilibrium validation
- Curve shift vs. movement-along check
- Short-run vs. long-run adjustment audit
- Cross-market symmetry (e.g., AD to SRPC)
Layer 2: Writing Telemetry (Checkmark)
- Patent-pending Essay Playback™ (1x–8x replay)
- 15–90s scratchpad graph-solving pauses
- External Paste Inspector (raw clipboard text)
- Passage-level calibrated AI confidence sliders
Layer 3: Restorative Economic Debrief
- Whiteboard oral graph walk-through
- Targeted transmission chain remediation
- Supervised graphical rewrite opportunities
- Replaces suspicion with causal mastery
1. The Disciplinary Dilemma in Economics Writing: Formulaic Precision vs. LLM Plausibility
Teaching students to think like economists requires instilling a disciplined mode of analytical reasoning. In high school AP Macroeconomics, AP Microeconomics, and introductory collegiate economics courses, students are trained to dissect complex economic shocks using formal graphical models. On the College Board AP exam, Free Response Questions (FRQs) demand a rigid, predictable explanatory architecture: identify the shock, assert the specific curve shift, trace the intermediate transmission mechanism through connected markets, and state the final equilibrium effects on variables like Real GDP, the Price Level, the Unemployment Rate, or the Real Interest Rate.
Because the discipline demands absolute precision, authentic economics writing exhibits distinct structural characteristics:
- Highly Standardized Terminology: Terms like “marginal revenue equals marginal cost”, “short-run aggregate supply”, “interest-sensitive consumption”, “monetary neutrality”, and “deadweight loss” have non-negotiable, universally agreed-upon definitions.
- Formulaic Sentence Blueprints: Teachers actively instruct students to write using tight causal templates: “Because [exogenous event], [determinant] changes, causing [Curve A] to shift [Right/Left], leading to a higher/lower [Price/Rate], which subsequently causes [Curve B] to...”
- Low Perplexity and High Determinism: In linguistic theory, perplexity measures how surprised a language model is by the next word in a sequence. Because high-scoring AP Economics essays strictly utilize standardized terminology and formulaic transitional phrases, their linguistic predictability is exceptionally high.
Generic whole-paper AI detectors (Turnitin, GPTZero, CopyLeaks) measure average perplexity and burstiness. When an honest student writes a textbook-perfect macroeconomic FRQ explanation, generic detectors flag it as 85%–100% AI-generated because the syntax is formulaic and deterministic.
The Generic Detector Failure
Initial Shock → ΔMoney Supply → ΔNominal Interest Rate → ΔGross Private Investment → ΔAggregate Demand
Flagged as 85%–100% AI! The student is penalized for demonstrating the exact disciplinary precision and formulaic clarity their teacher demanded.
Checkmark's Evidentiary Solution
- Passage-Level Sliders: Calibrated to ignore formulaic disciplinary phrasing.
- Essay Playback™: Verifies the 45-second scratchpad pause while drawing graphs.
- Causal Chain Audit: Validates step-by-step intermediate transmission logic.
Outcome: 100% Authentic Human Synthesis verified by process telemetry.
Conversely, when an LLM is prompted to answer an economics question, it produces fluent, polished paragraphs stuffed with macroeconomic keywords. However, because generative models are probabilistic token predictors rather than formal deductive engines, they frequently introduce subtle, fatal economic errors:
- Asserting that a change in the price level shifts the Aggregate Demand curve (confusing a movement along the curve with a shift in the curve).
- Inverting the direction of the Foreign Exchange (FOREX) value of the dollar following a domestic interest rate hike.
- Confusing the Short-Run Phillips Curve (SRPC) trade-off with the vertical Long-Run Phillips Curve (LRPC).
- Skipping the intermediate monetary transmission mechanism entirely (e.g., claiming that lower reserve requirements directly lower the inflation rate).
2. The Core Economic Models and the Anatomy of AI Hallucinations
To understand how AI-generated economic writeups fail, educators must examine how Large Language Models interact with the five fundamental graphical models taught in AP Macroeconomics and AP Microeconomics.
Five Core Economic Models: Graphical Mechanics vs. LLM Breakdown Modes
| Economic Model | Core Graphical Mechanics & Axes | Common LLM Hallucinations |
|---|---|---|
| 1. AD/AS & Long-Run Adjustment | Y-Axis: Price Level (PL); X-Axis: Real GDP (Y) Curves: AD, SRAS, LRAS |
• Confuses movement along AD with shift of AD. • Fails sticky wage long-run self-correction mechanism. |
| 2. Phillips Curve (SRPC / LRPC) | Y-Axis: Inflation Rate (π); X-Axis: Unemployment Rate (u) Curves: SRPC, LRPC (vertical at u_n) |
• Inverts AD shift movement on SRPC vs. SRAS shift of SRPC. • Confuses cyclical unemployment with natural rate. |
| 3. Money Market vs. Loanable Funds | Money: Nom. Interest (i) vs. Q_M Funds: Real Interest (r) vs. Q_LF |
• Conflates nominal vs. real interest rates. • Claims Fed open market ops directly shift loanable funds. |
| 4. Foreign Exchange (FOREX) | Y-Axis: Foreign Currency / USD; X-Axis: Q of USD Curves: Demand & Supply of USD |
• Inverts exchange rate balance (claims high r depreciates USD). • Reverses net exports (NX) trade feedback loop. |
| 5. Micro: Deadweight Loss & Elasticity | Y-Axis: Price (P), Marginal Cost; X-Axis: Q Curves: D (MSB), S (MPC/MSC) |
• Confuses DWL triangle with total tax revenue. • Inverts tax incidence on elastic vs. inelastic curves. |
Model 1: The Aggregate Demand / Aggregate Supply (AD/AS) Model
The AD/AS model is the foundational bedrock of AP Macroeconomics. It illustrates the determination of national output (Real GDP, $Y$) and the aggregate price level ($PL$).
       Price
       Level (PL)
         │           LRAS
         │            │     SRAS_1
         │            │      /
         │           │     /
     PL_1│───────────┼────/────────
         │           │   /
         │           │  /
         │           │ /
         │           │/
         │           │
         │           /│         │          / │          │         /  │        AD_1
         │        /   │            └───────/────┴──────────────── Real GDP (Y)
                     Y_F
How Authentic Students Analyze AD/AS Shocks:
- Determinant: Government spending ($G$) is a direct component of Aggregate Demand ($AD = C + I + G + NX$).
- Curve Shift: An increase in $G$ shifts the $AD$ curve to the right from $AD_1$ to $AD_2$.
- Short-Run Equilibrium: In the short run, the intersection of $AD_2$ and $SRAS_1$ results in an increase in both the equilibrium Price Level ($PL ↑$) and equilibrium Real GDP ($Y ↑$, creating an inflationary gap where $Y_1 > Y_F$).
- Long-Run Self-Correction: In the long run, nominal wages and input prices are flexible. Workers demand higher nominal wages to match the higher price level, which increases production costs for firms, shifting $SRAS$ to the left until Real GDP returns to full-employment output ($Y_F$) at an even higher price level ($PL_3$).
How LLMs Hallucinate AD/AS Analysis:
- The “Price Level Shift” Hallucination: The LLM will state: “Because inflation increased the price level, the Aggregate Demand curve shifted left.” An authentic economics student knows that a change in the aggregate price level causes a movement along the existing $AD$ curve (via the wealth effect, interest rate effect, and foreign purchases effect), never a shift of the curve itself.
- The Confused Long-Run Wage Adjustment: LLMs frequently claim that in the long run, the $AD$ curve shifts back to the left on its own, or that the Long-Run Aggregate Supply ($LRAS$) curve shifts rightward to meet the inflationary gap, completely ignoring the fundamental mechanism of sticky vs. flexible nominal input costs shifting $SRAS$.
Model 2: The Short-Run and Long-Run Phillips Curves (SRPC / LRPC)
The Phillips Curve illustrates the macroeconomic relationship between inflation and unemployment. Connecting shifts in the AD/AS model to movements and shifts on the Phillips Curve is one of the most heavily tested, high-discrimination skills on the AP Macroeconomics exam.
     Inflation
     Rate (π)
        │          LRPC
        │           │
        │           │     SRPC_1 (Higher expected inflation / Supply shock)
        │           │               │          │            π_1 │──────────┼──────────────
        │          │                  │          │               SRPC_0
        │          │                    └──────────┴────────────────── Unemployment Rate (u)
                   u_n
The Exact Concordance Rule:
- Shift in AD ⇔ Movement Along SRPC: When $AD$ shifts right ($PL ↑, Y ↑, u ↓$), the economy moves up and to the left along the fixed $SRPC_0$.
- Shift in SRAS ⇔ Shift of the entire SRPC: When a negative supply shock occurs (e.g., oil crisis shifting $SRAS$ left, causing stagflation with $PL ↑$ and $u ↑$), the entire $SRPC$ shifts up and to the right ($SRPC_0 → SRPC_1$).
How LLMs Fail the Phillips Curve:
Generative AI models routinely invert this geometric symmetry. When asked to evaluate an increase in consumer confidence (which shifts $AD$ right), an LLM will write: “Consumer confidence causes the Aggregate Demand curve to shift right, which simultaneously shifts the Short-Run Phillips Curve to the right.” This reveals an AI hallucination: shifting the $SRPC$ rightward implies higher inflation and higher unemployment (stagflation), which directly contradicts the student's own AD/AS claim that output expanded and unemployment fell!
Model 3: Money Market vs. Loanable Funds Market
AP Macroeconomics students must distinguish between the Money Market (central bank reserves, nominal interest rates, short-run liquidity) and the Loanable Funds Market (savers and borrowers, real interest rates, long-run capital accumulation).
         MONEY MARKET                         LOANABLE FUNDS MARKET
   Nominal                             Real
   Interest                            Interest
   Rate (i)       MS_1   MS_2          Rate (r)              S_LF
      │            │      │               │                   /
      │            │      │               │                 /
   i_1│────────────┼──────┼───────     r_1│────────────────/───────
      │            │     │               │               /
   i_2│────────────┼─────┼───────     r_2│───────────────/────────
      │            │     │               │             /
      │            │     │               │            /       D_LF
      │            │     │ MD            │           /
      └────────────┴──────┴───────        └───────────/────────────
                   Quantity of                        Quantity of
                     Money (M)                      Loanable Funds (Q)
Disciplinary Rules & AI Pitfalls:
- Axis Mismatch:
- Money Market vertical axis = Nominal Interest Rate ($i$); horizontal axis = Quantity of Money ($M$).
- Loanable Funds vertical axis = Real Interest Rate ($r$); horizontal axis = Quantity of Loanable Funds ($Q_{LF}$).
- LLM Failure: LLMs routinely label the Money Market with “Real Interest Rate” or claim that the Federal Reserve buys bonds in the “Loanable Funds Market,” conflating monetary policy operations with private financial intermediation.
- Crowding-Out Transmission:
- When a government runs a budget deficit, it issues Treasury bonds, increasing the demand for loanable funds ($D_{LF}$ shifts right), driving up real interest rates ($r ↑$). The higher real interest rate reduces private interest-sensitive capital investment ($I ↓$), an effect known as crowding out.
- LLM Failure: LLMs often claim that government deficit spending increases the supply of loanable funds or that crowding out occurs because “the government takes money out of the money supply,” demonstrating a broken transmission chain.
Model 4: Foreign Exchange (FOREX) Markets & Open-Economy Linkages
In open-economy macroeconomics, domestic monetary and fiscal policies transmit across borders through exchange rates and net exports ($NX$).
       Exchange Rate
       (Euros per USD)
             │             S_USD_1   S_USD_2
             │                                    │                               E_2   │──────────────────────────────
             │                                       │                                 E_1   │─────────────────────────────
             │                                 D_USD_2
             │                                /
             │                               /    D_USD_1
             └───────────────────────────────X────────────
                                               Quantity of USD
The 5-Step Open-Economy Transmission Chain:
How LLMs Fail FOREX Mechanics:
- The Inverted Inflow Error: LLMs often state: “When the Fed raises interest rates, investors pull their money out of the United States because borrowing is more expensive, causing the dollar to depreciate.” In reality, international financial capital seeks higher yields, so global investors demand US assets, causing capital inflows and dollar appreciation.
- The Circular Depreciation Loop: An LLM will claim that a depreciating dollar causes imports to increase and net exports to fall, completely reversing the price effects of international trade.
Model 5: AP Microeconomics: Elasticity, Deadweight Loss, and Tax Incidence
In AP Microeconomics, writing integrity centers on mathematical and geometric precision regarding market structures, consumer/producer surplus, and government interventions.
       Price ($)
           │
           │                      / Supply (MPC)
           │                     /
       P_c │────────────────────/────── (Price Paid by Buyers)
           │        ┌──────┐   /
       P_E │────────│ DWL  │──/────────
           │        └──────┘ /
       P_p │────────────────/────────── (Price Received by Sellers)
           │               /
           │              /    Demand (MSB)
           └─────────────/───────────── Quantity (Q)
                       Q_t  Q_E
Disciplinary Rules & AI Pitfalls:
- Tax Incidence & Elasticity: The economic burden of an excise tax falls more heavily on the side of the market that is more inelastic. LLM Failure: LLMs frequently write generic assertions such as: “The tax is split 50/50 between buyers and sellers because taxes are applied equally,” ignoring relative price elasticities entirely.
- Deadweight Loss Identification: Deadweight loss ($DWL$) represents the lost economic efficiency from mutually beneficial transactions that no longer occur ($Q_t < Q_E$). LLM Failure: LLMs often define deadweight loss as “the total revenue the government collects from the tax,” confusing government tax revenue with the deadweight loss triangle.
3. The 4-Step Chain of Causation: Authentic vs. AI-Fabricated Writing
To systematically evaluate whether an economics writeup was authored by an authentic student or generated by an LLM, teachers must audit the 4-Step Chain of Causation. The College Board rubric penalizes skipped transmission links, requiring students to explicitly state each causal node.
The 4-Step Macroeconomic Chain of Causation
| Step | Pedagogical Function | What Educators Must Audit |
|---|---|---|
| 1. Initial Exogenous Trigger | Identifies the policy shock or external disruption (Fed buys bonds, tax cut, oil embargo). | • Is the shock categorized correctly (Monetary, Fiscal, Supply-side)? • Are extraneous policies excluded? |
| 2. Primary Curve Shift | Names the specific curve and asserts the shift direction on the relevant model. | • Is the shift direction correct? • Does it match the student's graph? • Is it a shift vs. movement along? |
| 3. Intermediate Transmission Mechanism | Traces the transmission mechanism through connecting markets before reaching equilibrium. | • Is the link complete (Interest rate → Investment → Aggregate Expenditure)? • Are nominal vs. real variables separated? |
| 4. Final Equilibrium Impact | States the concrete end-state impacts on macroeconomic variables with zero hedging. | • Are final impacts explicit (PL, Y, u)? • Does the conclusion match initial claims? • Is short-run vs. long-run respected? |
Side-by-Side Comparison: Authentic Student vs. AI-Generated Response
Let's examine how a genuine AP Macroeconomics student and an LLM answer the identical Free Response prompt:
Prompt: Assume the United States economy is operating in a recessionary gap. The Federal Reserve conducts an open-market purchase of government bonds. Explain the step-by-step impact of this action on nominal interest rates, real output, and the price level in the short run.
Authentic Student Response
“When the Federal Reserve buys bonds on the open market, bank reserves increase, shifting the Money Supply (MS) curve to the right in the money market. This rightward shift lowers the nominal interest rate (i).
Because interest rates are lower, the cost of borrowing decreases, leading to an increase in interest-sensitive business investment (I) and consumer durable spending (C).
Since Investment and Consumption are components of Aggregate Demand (AD = C + I + G + NX), the AD curve shifts to the right.
In the short run, the rightward shift of AD intersects the upward-sloping SRAS curve at a higher equilibrium, resulting in an increase in Real GDP (Y) and an increase in the Price Level (PL).”
• Perfect 4-step chain of causation.
• Explicit intermediate variables (MS, i, I, C, AD, SRAS, Y, PL).
• Low perplexity; formulaic structure.
• Generic AI Detector: Flagged 84% AI! (False Positive)
• Checkmark Verdict: 100% Authentic (Verified via Playback).
AI-Generated Response (ChatGPT-4o)
“The Federal Reserve's open-market purchase of government bonds is an expansionary monetary policy that injects liquidity into the broader financial system. This substantial increase in monetary reserves creates downward pressure on interest rates across all sectors, making borrowing more accessible and stimulating both business enterprise and consumer spending.
As a result, aggregate economic activity expands significantly. The overall aggregate demand shifts to the right, which effectively closes the recessionary gap, driving real output and gross domestic product higher while stabilizing the macroeconomic price level, though inflation may fluctuate depending on long-run supply elasticities and fiscal policy responses.”
• Fluent, elevated vocabulary (“injects liquidity”, “business enterprise”).
• Skips the formal Money Market graph mechanics.
• Fails to state that Price Level INCREASES (claims it “stabilizes”).
• Introduces irrelevant fiscal policy hedging.
• Generic AI Detector: Passed as 12% AI! (False Negative)
• Checkmark Verdict: AI-Generated Jargon.
4. The Economics Evidentiary Matrix
To evaluate student writing fairly, social studies departments and economics instructors must move away from single-vector grading. The following matrix illustrates the profound differences between traditional subjective grading, generic black-box AI detection, and Checkmark Plagiarism's comprehensive Graph-to-Prose Telemetry.
Economics Evidentiary Comparison Matrix
| Evaluation Dimension | Traditional Rubric Grading | Generic AI Detectors | Checkmark Plagiarism Suite |
|---|---|---|---|
| 1. Graph-to-Prose Concordance | Relies on teacher memory during late-night grading; easily fatigued. | Zero awareness of drawn graphs or image uploads; ignores axis notations. | Synchronizes drawn graph notations with prose descriptions. |
| 2. Perplexity Handling (AP Terminology) | Recognizes formulaic clarity as good disciplinary writing. | Punishes formulaic AP definitions as “High AI” (false positive trap). | Calibrated sliders; ignores formulaic false-positive bias. |
| 3. Writing Process Telemetry | No visibility into how text was constructed over timeline. | Zero telemetry; cannot distinguish 2-sec paste from 45-min composition. | Patent-Pending Essay Playback™ captures 1x–8x keystrokes. |
| 4. Cognitive Pause Verification | Cannot observe student pauses while consulting scratch-paper graphs. | Blind to pauses; sees only the submitted static string. | Tracks authentic 15–90s pauses while referencing graphs. |
| 5. External Paste & Clipboard Capture | Unknown if student pasted prompt answers or LLM text. | Cannot retrieve raw clipboard; misses subsequent rewordings. | External Paste Inspector archives exact raw pasted text. |
| 6. Disciplinary Rubric Autograding | Manual, time-consuming written comments per paper. | No rubric feedback; only opaque % probability. | AI Autograder with quote-anchored AP criterion justifications. |
| 7. Restorative Evidence Pedagogy | Subjective confrontation without hard proof. | Adversarial, unprovable score; damages student-teacher trust. | Defensible receipts; turns integrity flags into learning moments. |
5. Step-by-Step Economics Teacher Audit Protocol
When evaluating AP Macroeconomics and Microeconomics assignments, teachers can implement this 4-phase forensic audit protocol to verify authentic student reasoning, diagnose conceptual misunderstandings, and uncover outsourced AI writing.
The 4-Phase Economics Writing Integrity Audit Protocol
Phase 1: Graph-to-Text Concordance Audit
Compare the student's submitted physical or digital graph against their written analysis. Verify axis labeling ($PL$ vs. $Y$ for AD/AS; $π$ vs. $u$ for Phillips Curve; $i$ vs. $Q_M$ for Money Market; $r$ vs. $Q_{LF}$ for Loanable Funds). If the student drew a Money Market graph with $i$ on the vertical axis but writes about “real interest rates falling on the money market,” this discrepancy indicates an LLM-generated writeup disconnected from the graph.
Phase 2: 4-Step Transmission Chain Verification
Scan the written text for complete causal links (Shock → Determinant → Curve Shift → Transmission → End). Did the student explain why the next curve shifted (e.g., lower interest rates stimulate interest-sensitive investment, or did they jump straight to GDP)? Audit for unnecessary hedging (“This may depend on fiscal policy...”) on isolated prompts.
Phase 3: Telemetry & Essay Playback™ Investigation
Scrub the writing timeline at 1x–8x speed. Look for the characteristic 15 to 90-second cognitive pause where the student draws the graph on scratch paper before typing the equilibrium conclusion. Verify backspaces and self-corrections (e.g., changing “increases” to “decreases” as they inspect their graph). Flag instant bulk pastes or constant 60+ WPM mechanical transcription.
Phase 4: Restorative Economics Conference Protocol
Open conferences with objective telemetry and graphical discrepancies rather than accusations. Ask the student to walk through the graph on a whiteboard: “Can you explain the transmission mechanism from bond purchases to investment spending using this diagram?” Provide targeted remediation exercises and supervised rewrites for revised credit.
6. How Checkmark Plagiarism Empowers AP Economics Educators
Checkmark Plagiarism delivers an integrated, educator-first suite designed specifically to address the disciplinary complexities of economics and social studies writing.
Patent-Pending Essay Playback™
Reconstructs the drafting session at 1x to 8x speed. Visually reveals the authentic 15–90 second cognitive pauses while students work through graphical models on scratch paper.
External Paste Buffer Inspector
Archives the exact raw text of external clipboard insertions at the millisecond of entry, capturing original AI outputs even if the student subsequently rewrites or paraphrases every word.
Calibrated Passage-Level Sliders
Replaces document-wide percentage scores with sentence-level evidence cards. Calibrated to recognize standardized AP economics terminology without triggering false positive alarms.
AI Autograder with Rubric Sync
Evaluates FRQs against College Board rubrics with quote-anchored justifications and direct 1-click gradebook passback into Canvas, Buzz LMS, and Google Classroom.
7. Real Classroom Case Scenarios
Exonerating a False Positive on an AP Macroeconomics FRQ
The Scenario:
An AP student submits an FRQ explaining how government deficit spending causes crowding out: “An increase in government borrowing increases the demand for loanable funds, shifting the demand curve to the right and driving up real interest rates...” A legacy AI detector flags the submission as 91% AI-Generated due to formulaic College Board vocabulary.
The Checkmark Resolution:
- Essay Playback™: Reveals 38 minutes of active composition with 42-second average pauses between market explanations.
- Revision History: The student corrected three typographical errors in the loanable funds transmission step.
- Outcome: The student was immediately exonerated; trust was preserved without adversarial confrontation.
Uncovering an LLM Hallucination in Open-Economy FOREX Analysis
The Scenario:
A high school senior submits an essay on Fed rate hikes and foreign exchange. The prose is articulate (“monetary tightening regimes”), but concludes that higher US interest rates cause the dollar to depreciate and American net exports to surge.
The Checkmark Resolution:
- Economic Contradiction: Higher interest rates attract capital inflows, appreciating the dollar and reducing net exports ($NX ↓$).
- Paste Inspector: 450 words appeared in a single 1.2-second external clipboard paste.
- Outcome: In conference, the student walked through the FOREX diagram, admitted using ChatGPT, and completed an in-class graph rewrite.
Coaching Uncited Economic Data Patchwriting in AP Microeconomics
The Scenario:
In an AP Micro project on negative externalities, a student included empirical statistics on carbon emissions and marginal social cost curves. A generic tool flagged a 42% similarity score, triggering a potential academic dishonesty referral.
The Checkmark Resolution:
- Uncited Source Badge: Checkmark differentiated missing citation tags from intentional plagiarism.
- Essay Playback™: Proved the student spent over two hours writing the analytical synthesis around Federal Reserve (FRED) data.
- Outcome: The teacher coached proper APA/MLA data attribution; the student resubmitted for full credit.
8. Economics & Social Studies Department Implementation Checklist
Before selecting or renewing academic integrity and grading software, Social Studies Curriculum Coordinators, Economics Department Chairs, and Instructional Technology Directors should verify the following capabilities:
AP Economics Writing Integrity Procurement & Pedagogy Checklist
1. Graph-to-Prose Process Auditing
Provides patent-pending keystroke replay (Essay Playback™ at 1x–8x) to observe authentic cognitive pauses while students reference scratchpad graphs.
2. Raw Clipboard & External Paste Preservation
Archives the exact original text of external clipboard insertions, even if the student subsequently edits, rewords, or paraphrases the text.
3. Calibrated Passage-Level Evidence (No Black-Box Scores)
Avoids whole-paper percentage scores that falsely penalize formulaic AP economics definitions (low perplexity), providing granular sentence-level cards.
4. Short-Text Guardrails
Displays N/A for short passages (<150 words) to prevent unreliable statistical guessing on brief economic definitions.
5. AP Rubric Autograding with Quote-Anchored Justifications
Uploads custom College Board rubrics and generates quote-anchored criterion justifications with 1-click gradebook sync to Canvas, Buzz LMS, and Google Classroom.
6. Differentiated Citation & Uncited Source Badges
Accidental missing citations on government economic data (FRED, BLS) are distinguished from deliberate copy-paste cheating via dedicated badges.
7. Zero-Training Data Privacy & Statutory Compliance
Legally warrants student essays and economic analyses are NEVER used to train commercial AI models, ensuring strict compliance with FERPA and COPPA.
9. Frequently Asked Questions (FAQ)
1. Why do generic AI detectors frequently flag high-scoring AP Economics essays as “AI-Generated”?
Generic AI detectors evaluate perplexity (word choice predictability) and burstiness (sentence structure variation). Because AP Economics students are explicitly trained to use precise, formulaic College Board phrasing (such as “an increase in the money supply lowers nominal interest rates, stimulating interest-sensitive investment”), their writing has naturally low perplexity and consistent sentence rhythm. Generic detectors misinterpret this disciplined academic precision as machine-generated text. Checkmark eliminates this bias by evaluating writing through passage-level evidence cards supported by Essay Playback™ process verification.
2. Can AI models like ChatGPT or Claude draw or interpret AP economics graphs accurately in 2026?
While multimodal LLMs can generate and visually inspect basic charts, they frequently fail at the rigorous geometric and causal conventions required by AP Economics. AI models routinely mislabel axes (e.g., placing nominal interest rates on a loanable funds graph), invert shift directions, confuse movements along a curve with shifts of a curve, and fail to maintain symmetry between connected models (such as an AD shift causing a movement along the Short-Run Phillips Curve).
3. How does Essay Playback™ prove a student drew their own graph while writing on a computer?
When students write economics writeups while solving graphs on paper, their drafting pattern shows distinct cognitive pauses lasting 15 to 90 seconds. A student will write a sentence identifying a shock, pause while they draw the shift on their physical scratch paper, and then resume typing to explain the resulting change in equilibrium. Essay Playback allows teachers to watch this exact temporal sequence at 1x to 8x speed, providing undeniable proof of active human problem-solving.
4. How does Checkmark handle students who type their economics notes offline before pasting them into the LMS?
If a student drafts an assignment offline in a separate document and pastes the completed text into the Checkmark assignment editor, the External Paste Inspector logs a timestamped paste event and highlights the inserted text. Rather than issuing an automatic penalty, the system flags the submission for educator review. The teacher can then ask the student to share their preliminary scratchpad graphs or conduct a quick 2-minute oral check to confirm conceptual understanding.
5. How does the AI Autograder evaluate the 4-step chain of causation on Free Response Questions?
Checkmark’s AI Autograder parses student submissions against specific rubric criteria mapped to the College Board's causal requirements. The system scans for each link in the chain (Trigger → Determinant → Shift → Transmission → Equilibrium Impact) and generates quote-anchored feedback cards showing exactly where the student satisfied a criterion or where a transmission step was omitted. All autograded marks remain editable drafts until finalized by the teacher.
6. Does Checkmark store or use student economics submissions to train AI models?
No. Checkmark maintains a strict Zero-Training Data Privacy Policy. Student submissions are never used to train, fine-tune, or validate public or proprietary machine learning models. All data is processed securely with AES-256 encryption at rest and TLS 1.3 in transit, ensuring full compliance with FERPA, COPPA, and state student privacy standards.
7. How does Checkmark integrate with Canvas LMS, Google Classroom, and Buzz LMS for social studies departments?
Checkmark integrates seamlessly via standard LTI 1.3 protocols. Teachers can create Checkmark-enabled assignments directly inside their existing LMS workflow. Students compose or submit their work within the familiar interface, and teachers can review playback telemetry, inspect paste events, and sync finalized rubric scores and written feedback directly back to the LMS gradebook with a single click.
10. Conclusion: Stop Guessing, Start Trusting
Teaching economics is about empowering students to understand the causal forces that shape our world. In an educational landscape increasingly complicated by generative AI, educators cannot rely on opaque, punitive AI detectors that punish students for writing with formulaic precision while letting hallucinated economic fallacies slip through.
By adopting a multidimensional evidentiary approach—anchored by Graph-to-Prose Concordance, 4-Step Chain of Causation Verification, and patent-pending Essay Playback™—economics teachers can foster authentic learning, protect honest students, and hold meaningful, growth-oriented conversations.
Ready to bring graph-to-prose concordance & writing telemetry to your AP Economics classroom?
Empower your department with Checkmark's multidimensional academic integrity platform today.